Introduction: Why Debugging Skills Are the Key to Game Development
Bugs are unavoidable in game development. The work of tracking down and fixing whatever makes the player's input produce the wrong result or the game crash, that is, debugging, has an enormous influence on both the quality and the speed of your development.
Most beginners lean on the print() function as the easiest debugging tool available. As the project grows, though, that approach hits its limits quickly.
- A flood of logs: the console fills up with output and the information that actually matters disappears in the noise.
- Cleanup work: you have to delete a pile of
print()statements afterward, and there's always a risk of missing some. - Performance concerns:
print()calls left in a release build cost a small amount of performance.
This article covers Godot Engine's built-in debugging tools and, in particular, how to use print_debug() strategically to fix bugs more efficiently.
What You'll Learn
- When to use
print_debug/push_warning/push_error- Breakpoints and stepping: pausing on a single line to inspect it
- The remote inspector: tweaking the running game in place
- Practical debugging techniques with
assertand_draw()
Choosing the Right Log Function: print vs print_debug vs push_error
Godot offers several ways to output a message, each with its own proper role. Using them correctly is the first step toward clean debugging.
| Function | In Debug Builds | In Release Builds | Main Use |
|---|---|---|---|
print() | Outputs | Outputs | Very temporary tests during development. Should not stay in production code. |
print_debug() | Outputs | Usually does not output* | Temporary information checks during development and testing. |
push_warning() | Outputs as a warning | Usually does not output* | For unexpected states or deprecated usage that isn't fatal. |
push_error() | Outputs as an error | Usually does not output* | For clear error states that make it hard for the program to continue. |
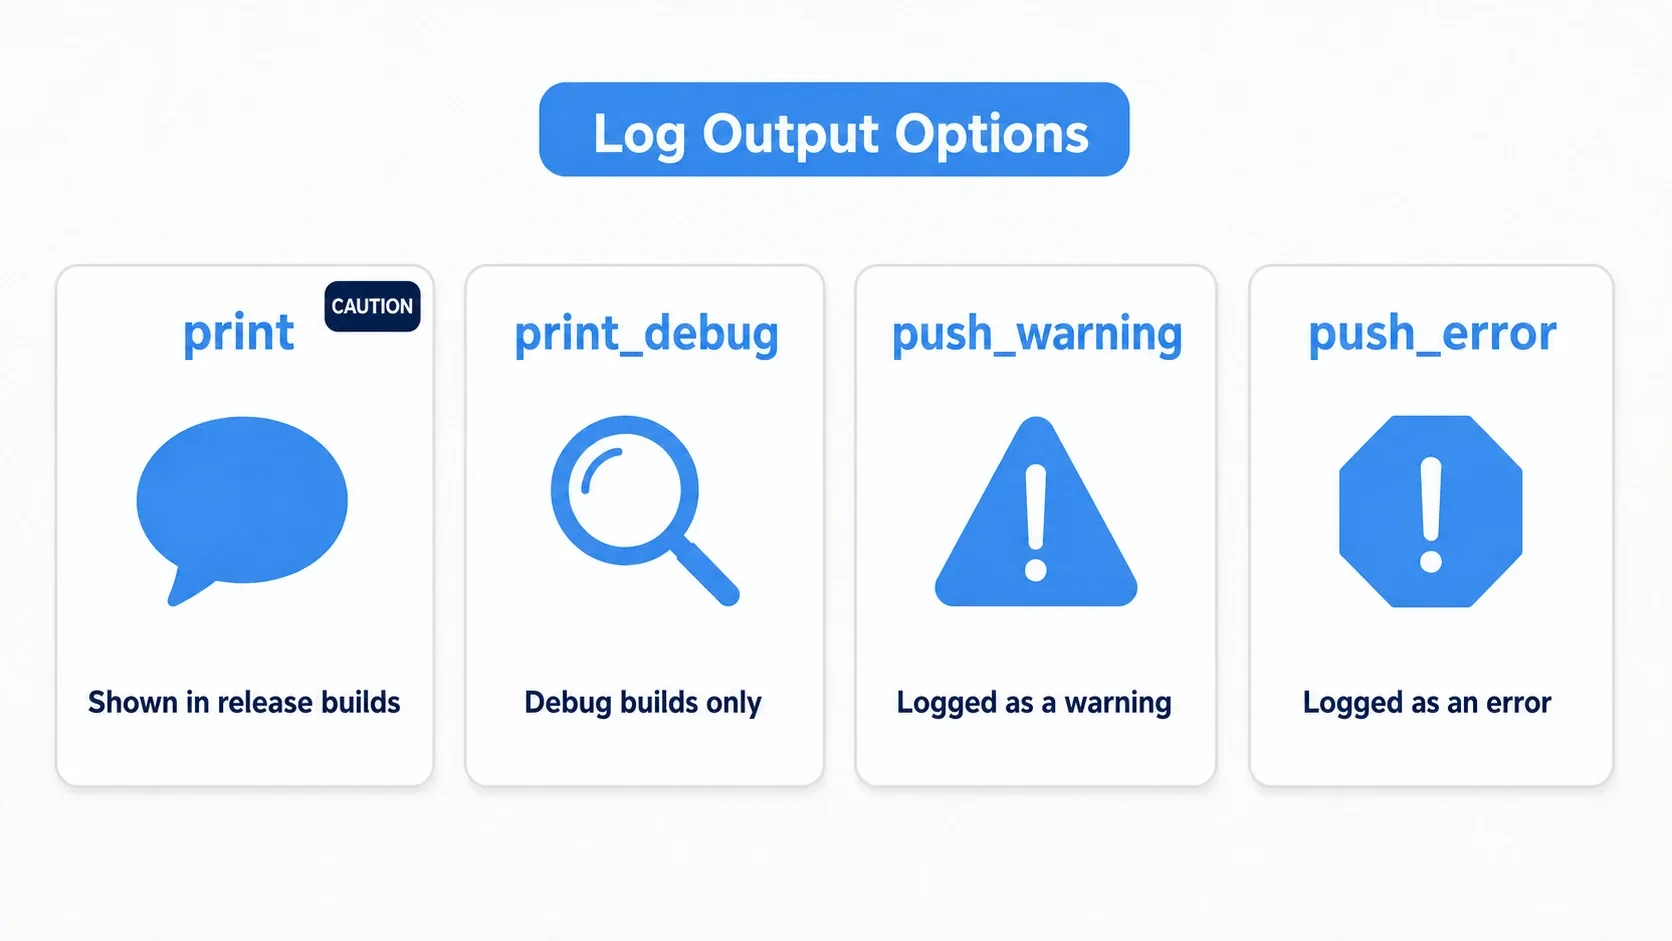
*Behavior can vary depending on build settings and runtime environment. For logs that absolutely must not appear in the shipped game, guard them explicitly with if OS.is_debug_build():.
Because print_debug() generally only outputs in debug builds, it's easy to embed debug information right in your code. Going further, push_warning() and push_error() record their output in the debugger's Errors tab along with a stack trace, which makes the source of a problem much easier to locate.
func load_level(level_id: int):
    if level_id < 0:
        # Warn that an unexpected value was passed in
        push_warning("Invalid level ID was passed: %d" % level_id)
        return

    print_debug("Starting to load level %d." % level_id)
    # ... loading logic
Getting the Most Out of the Godot Debugger: Dissecting Code While It Runs
The Godot debugger is not just a log viewer. It gives you a set of powerful tools for pausing execution and examining the game's internal state in detail.
1. Breakpoints and Stepping
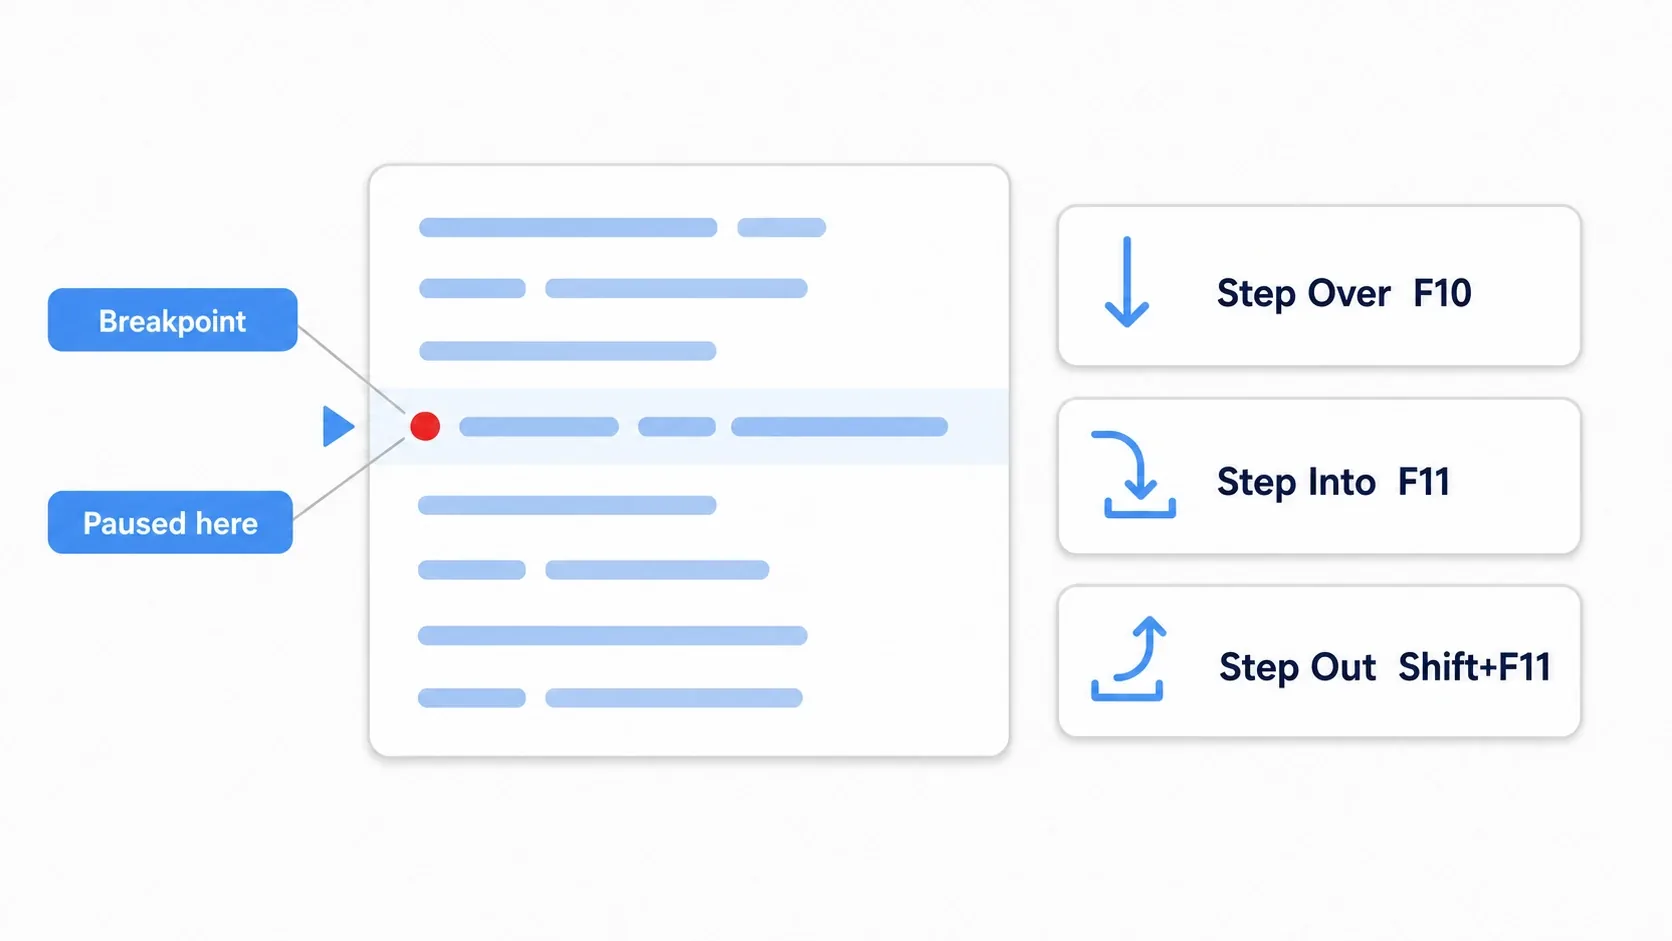
Breakpoints are the most fundamental and the most powerful debugging feature. Click to the left of a line number in the script editor and the game halts the instant execution reaches that line.
While execution is paused, you can do the following.
- Step Over (
F10): runs the current line and moves to the next one. If there's a function call, it does not go inside it. - Step Into (
F11): runs the current line. If there's a function call, it goes inside that function. - Step Out (
Shift+F11): runs the rest of the current function and returns to the line after the call. - Variables: the Debugger panel in the lower left shows the values of every variable in the current scope. No more writing endless
print()calls.
2. The Remote Inspector: Manipulating the Running Scene in Real Time
The Remote tab in the debugger panel shows the scene tree of the running game as it currently exists. With it you can do things like the following.
- Live property editing: select a node and change properties (position, color, custom variables) in the Inspector in real time. Perfect for fine-tuning UI or instantly seeing the effect of a physics parameter change.
- Adding and removing nodes on the fly: add or delete nodes in the scene tree and test the consequences.
3. Profiler and Monitors: Pinpointing Performance Bottlenecks
The game is slow, the frame rate won't hold steady: that's when the Profiler earns its keep. Start it, run the game, and it measures each function's execution time and call count in milliseconds. Which piece of logic costs the most becomes obvious, and you can aim your optimization work precisely.
The Monitors tab, meanwhile, graphs FPS, memory usage, and object counts in the scene in real time, which helps you see the whole shape of a performance problem.
Practical Code: assert and Custom Visual Debugging
Beyond print and the debugger, let's look at some more advanced techniques.
Contract-Based Debugging With assert
An assert statement writes down a contract for your program: "this condition must always be true." If the condition turns out false during a debug run, the program stops right there and reports an error. That means bugs surface earlier and closer to their actual cause.
# Function that changes the player's HP
func set_health(new_health: int):
    # State the contract: HP must never be negative
    assert(new_health >= 0, "Attempted to set a negative HP value: %d" % new_health)

    health = new_health
    print_debug("Player HP updated to %d." % health)
If a negative value is ever passed as new_health, this code stops immediately with an error during a debug run. In release builds assert statements are ignored, so there's no performance cost.
Custom Visual Debugging With _draw
An enemy AI's detection range, a navigation path, a physics force vector: printing these as numbers rarely gives you an intuitive picture. The _draw() function lets you draw debug information directly onto the game screen.
# Enemy character script
extends CharacterBody2D

@export var vision_radius: float = 200.0
var can_see_player: bool = false

# Flag to enable debug drawing
@export var enable_debug_draw: bool = true

func _process(delta):
    var new_can_see = check_player_visibility()
    # Only request a redraw when the state changes
    if new_can_see != can_see_player:
        can_see_player = new_can_see
        queue_redraw()  # Required to call _draw() again

func check_player_visibility() -> bool:
    # Logic for whether the player is visible...
    return false

func _draw():
    if not enable_debug_draw:
        return

    # Draw the detection range as a circle
    var circle_color = Color.RED if can_see_player else Color.GREEN
    draw_circle(Vector2.ZERO, vision_radius, circle_color.lighten(0.5))
Important:
_draw()is not called automatically every frame. When you want to update what's drawn, you must callqueue_redraw()to request a redraw.
A node with this script attached draws its own detection range as a circle while enable_debug_draw is true. The color changes depending on whether it has spotted the player, so the AI's behavior is visible at a glance.
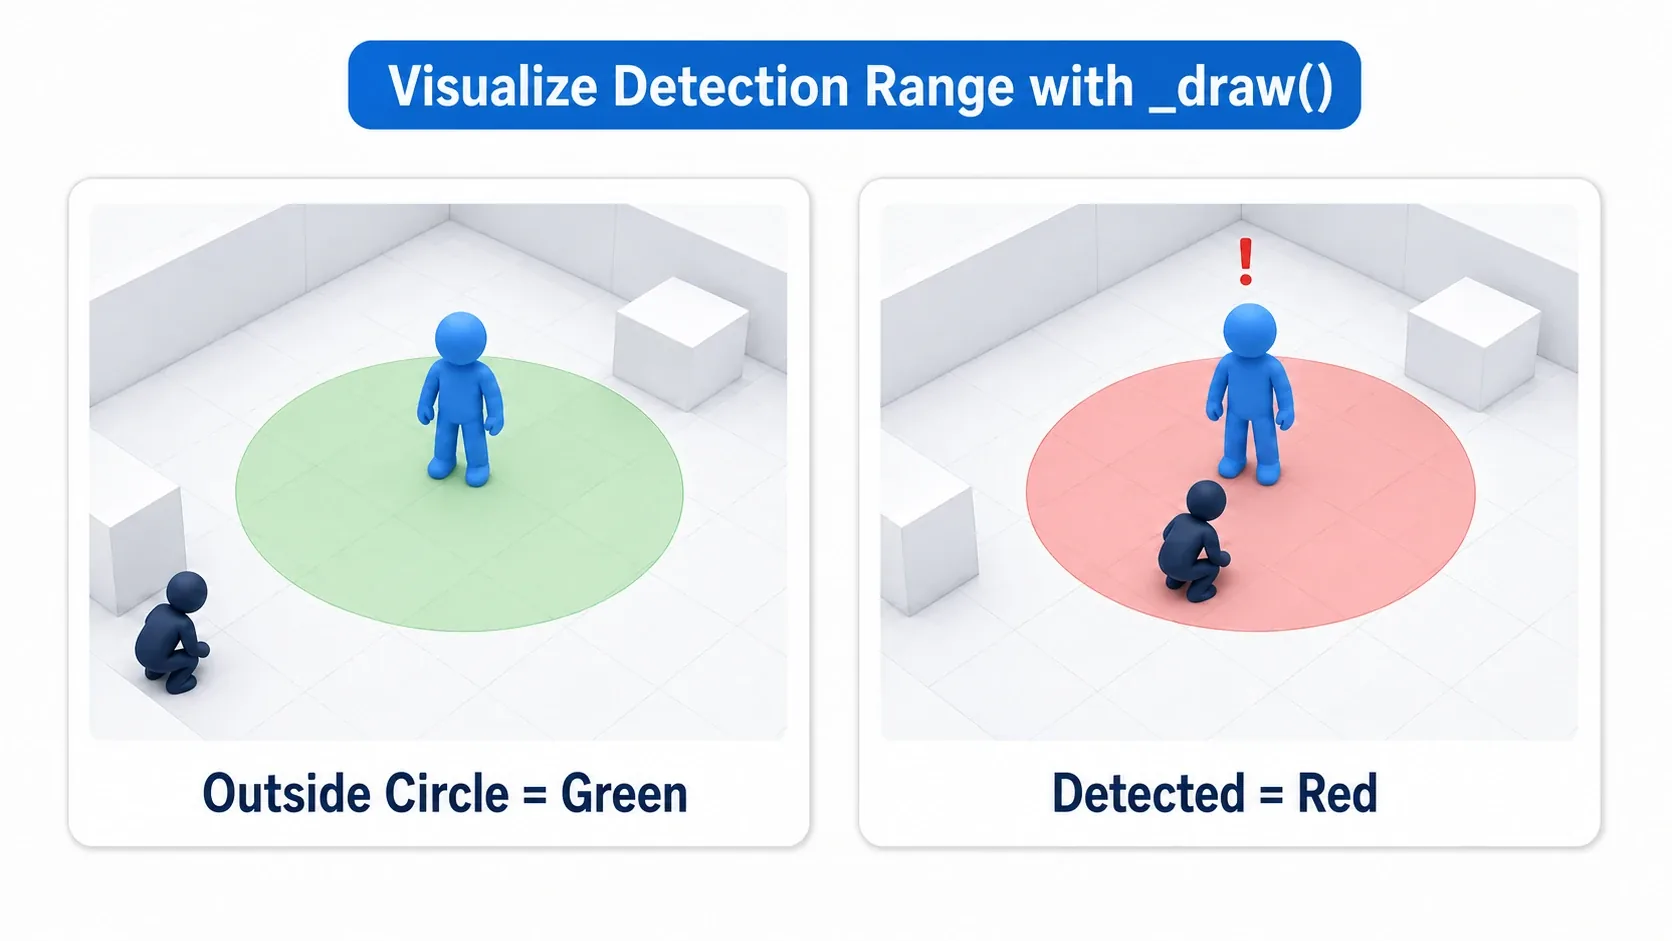
Enemy AI in a stealth game, attack ranges in a tower defense game: remember that any logic involving a "range" is far faster to verify by drawing it than by reading logs.
Common Mistakes and Best Practices
Debugging efficiently means avoiding the common anti-patterns and turning the best practices into habits.
| Common Mistake | Best Practice |
|---|---|
Solving everything with print(). | Use breakpoints to trace complex logic and print_debug() to check state transitions. |
Commenting out print() statements once you're done debugging. | With print_debug() there's nothing to comment out, since it's disabled automatically in release builds. |
| Optimizing performance on a hunch. | Use the Profiler to identify the bottleneck from objective data before you start optimizing. |
Chasing physics bugs with print() alone. | Enable Visible Collision Shapes in the Debug menu and check hitboxes visually. |
| Adjusting UI positions by editing code and re-running over and over. | Use the remote inspector to adjust position and size directly while the game runs and see the result immediately. |
Summary: Establishing an Efficient Debugging Flow
Efficient debugging in Godot Engine starts with moving beyond plain print() and combining the following tools and techniques.
- Use the Godot debugger: for complex bugs and hard-to-follow logic, lean on breakpoints, stepping, and the remote inspector, and make a habit of looking inside your code's state.
- Use
print_debug()strategically: for tracking state and checking temporary values during development, useprint_debug(), which doesn't affect release builds, and keep your codebase clean. - Optimize with the Profiler: when performance problems appear, use the Profiler to identify the bottleneck and narrow the scope of your debugging.
Master these techniques and you'll cut the time you spend fixing bugs dramatically, leaving more of it for the creative side of your game.