"It worked yesterday!" "There's a red error but I can't make sense of it." Bugs are simply part of programming. A great developer isn't someone who never writes bugs—it's someone who can find and fix bugs efficiently. That process is called debugging.
Unity ships with several tools to help you debug. In this article, we'll cover the fundamentals every beginner should know: how to use Debug.Log (the easiest tool of all), how to read error messages (especially the infamous NullReferenceException), and how to step through code with a debugger.

What You'll Learn
- When to use
Debug.Log,LogWarning, andLogError- How to read error messages and jump straight to the offending line
- What causes the most common error,
NullReferenceException, and how to fix it- How to get started with breakpoint debugging and step execution
Tested with: Unity 6 (6000.x) / Input System
The Simplest Debugging Tool: Debug.Log()
Debug.Log() prints a message to the Console window in the Unity Editor. It's the simplest and most effective way to check whether a specific part of your program is actually running, and to see what a variable's value is at that moment.
using UnityEngine;
using UnityEngine.InputSystem;

public class DebugExample : MonoBehaviour
{
    private int score = 0;

    void Start()
    {
        // Print a message when the game starts
        Debug.Log("Game started.");
    }

    void Update()
    {
        // Check whether the button was pressed
        if (Keyboard.current != null && Keyboard.current.spaceKey.wasPressedThisFrame)
        {
            score += 10;
            // Print the current value of the score variable
            Debug.Log("Space key pressed. Current score: " + score);
        }
    }
}
You can open the Console window from Window > General > Console at the top of the Unity Editor.
Note: When printing variables, string interpolation like
$"Score: {score}"is easier to read than string concatenation like"Score: " + score. It also lets you combine multiple values in one line, e.g.Debug.Log($"Position: {transform.position}, HP: {hp}"). One more trick: the second argument—pass it likeDebug.Log("Hit!", gameObject)and clicking that line in the Console highlights the originating object in the Hierarchy. The time spent hunting "which enemy printed this?" drops to zero.
Debug.LogWarning() and Debug.LogError()
The Debug class offers variations you can choose based on how serious the message is.
Debug.LogWarning(): Prints a warning message (yellow icon). Use it for situations that aren't errors but deserve attention (e.g., an option that hasn't been configured).Debug.LogError(): Prints an error message (red icon). Use it when something critical has gone wrong that prevents your program from working properly.
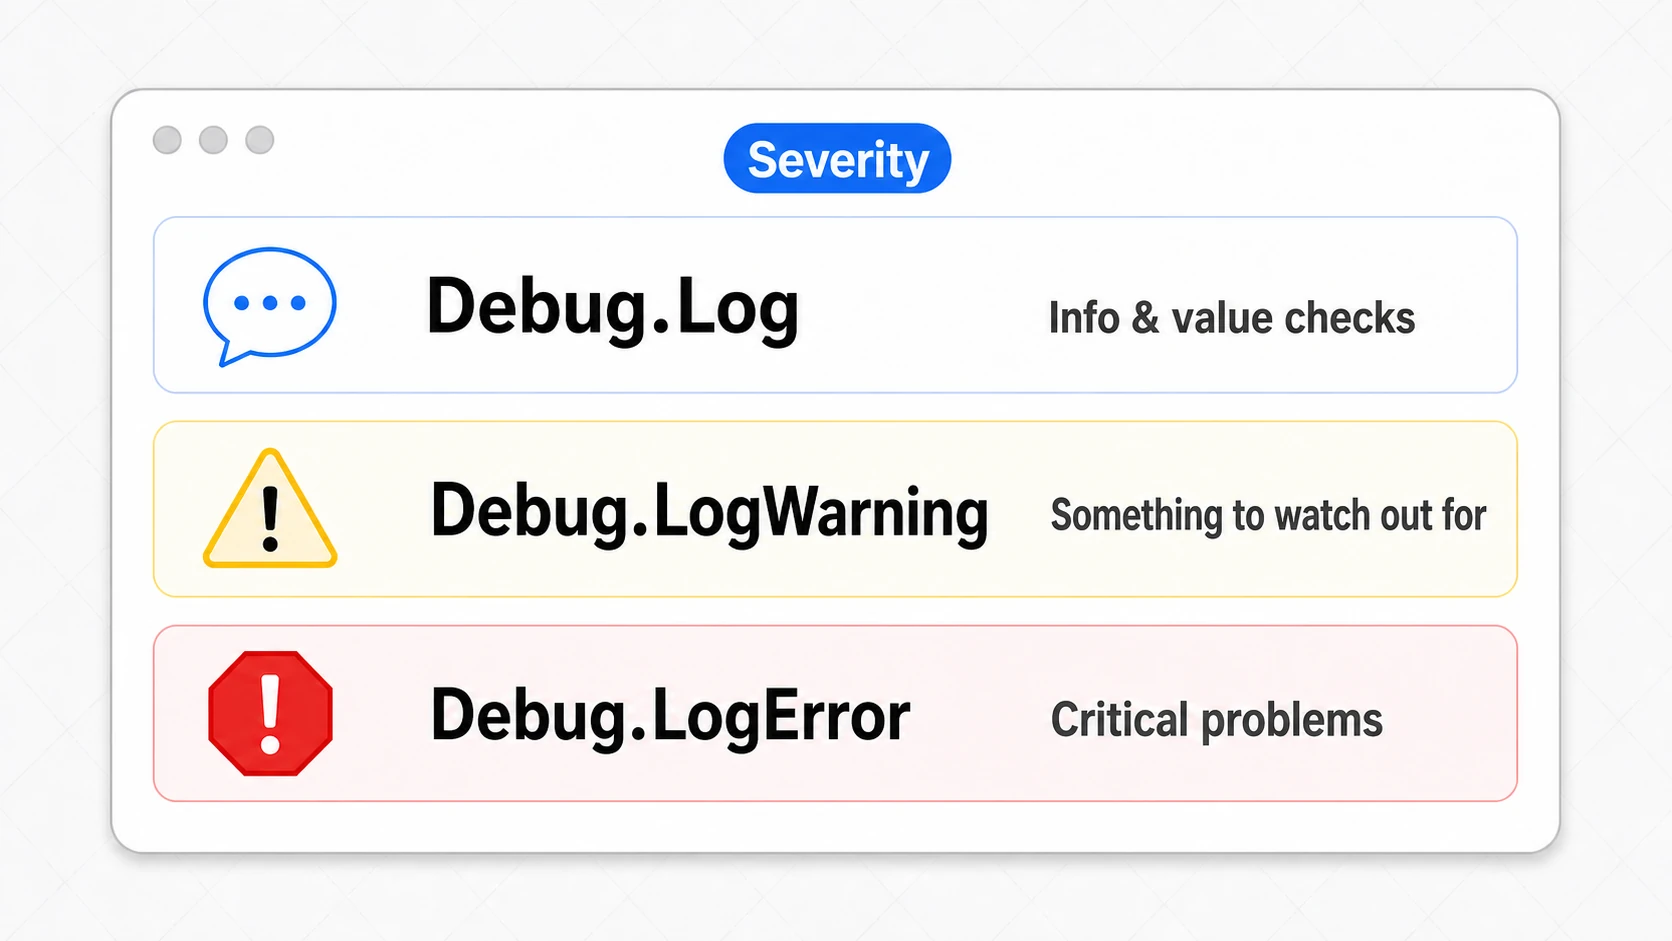
Using these appropriately keeps your console logs organized and lets you gauge the severity of a problem at a glance.
How to Read Error Messages
When something goes wrong in your program, Unity displays a red error message in the Console. These messages can feel overwhelming at first, but read them calmly—they contain vital clues for solving the problem.
The Most Common Error: NullReferenceException
This is one of the errors you'll run into most often. It occurs when you "try to access a method or property on an object that doesn't exist (is null)."
Think of it as "opening a box that was supposed to have something inside, only to find it empty." You have the variable (the box), but it doesn't hold a reference to an actual object—and calling a method on it triggers this error.
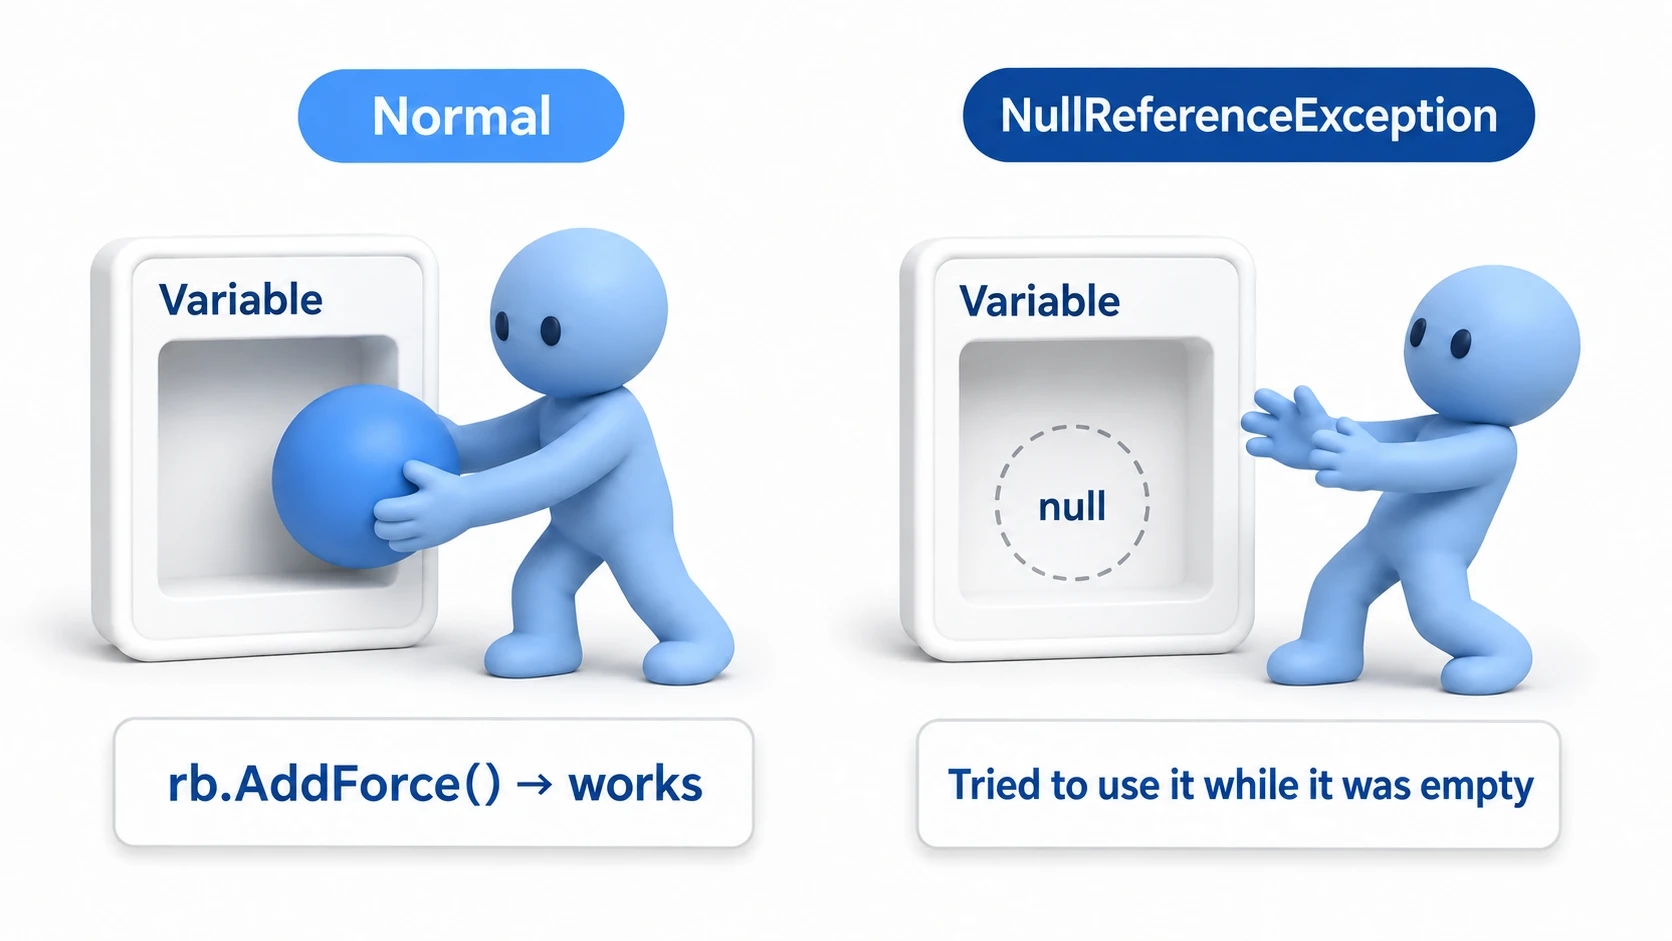
Common causes:
- You tried to get a component with
GetComponent<T>(), but it wasn't actually attached. - A
publicfield that should be assigned in the Inspector window was left empty. In the editor, this shows up asUnassignedReferenceExceptionwith the field name in it.
// Example: accessing a Rigidbody that isn't attached
public class NullRefExample : MonoBehaviour
{
    private Rigidbody rb;

    void Start()
    {
        // Nothing is ever assigned to rb here
    }

    void FixedUpdate()
    {
        // rb is null, so a NullReferenceException occurs here
        rb.AddForce(Vector3.up);
    }
}
How to fix it:
Double-click the error message to jump to the line of code where the error occurred. Then figure out which variable on that line is null—print it with Debug.Log, or guard it with if (variable != null) to narrow down the cause.
Step Execution with the Debugger
Debug.Log is quick and easy, but sometimes you want to pause your program and carefully examine the state of every variable at that exact moment. That's what a debugger is for.
Code editors like Visual Studio and Rider come with built-in debuggers that integrate with Unity.
Basic workflow:
- Switch to Debug Mode: Use the bug button in the status bar at the bottom right of the Unity editor to set Code Optimization to Debug Mode (in Release Mode, the debugger can't attach).
- Set a breakpoint: In your code editor, click to the left of the line you want to inspect to place a red dot (breakpoint).
- Attach to Unity: Press the "Attach to Unity" button in your code editor (usually an icon that looks like a play button) to connect the debugger to the Unity Editor.
- Run the game: Press Play in the Unity Editor.
- Execution pauses: When the program reaches the line with your breakpoint, it pauses there.
- Inspect variables and step through: While paused, your editor's debug window shows a list of current variable values. From here you can use operations like "Step Over" (advance one line) and "Step Into" (enter a function) to trace your program's behavior line by line.
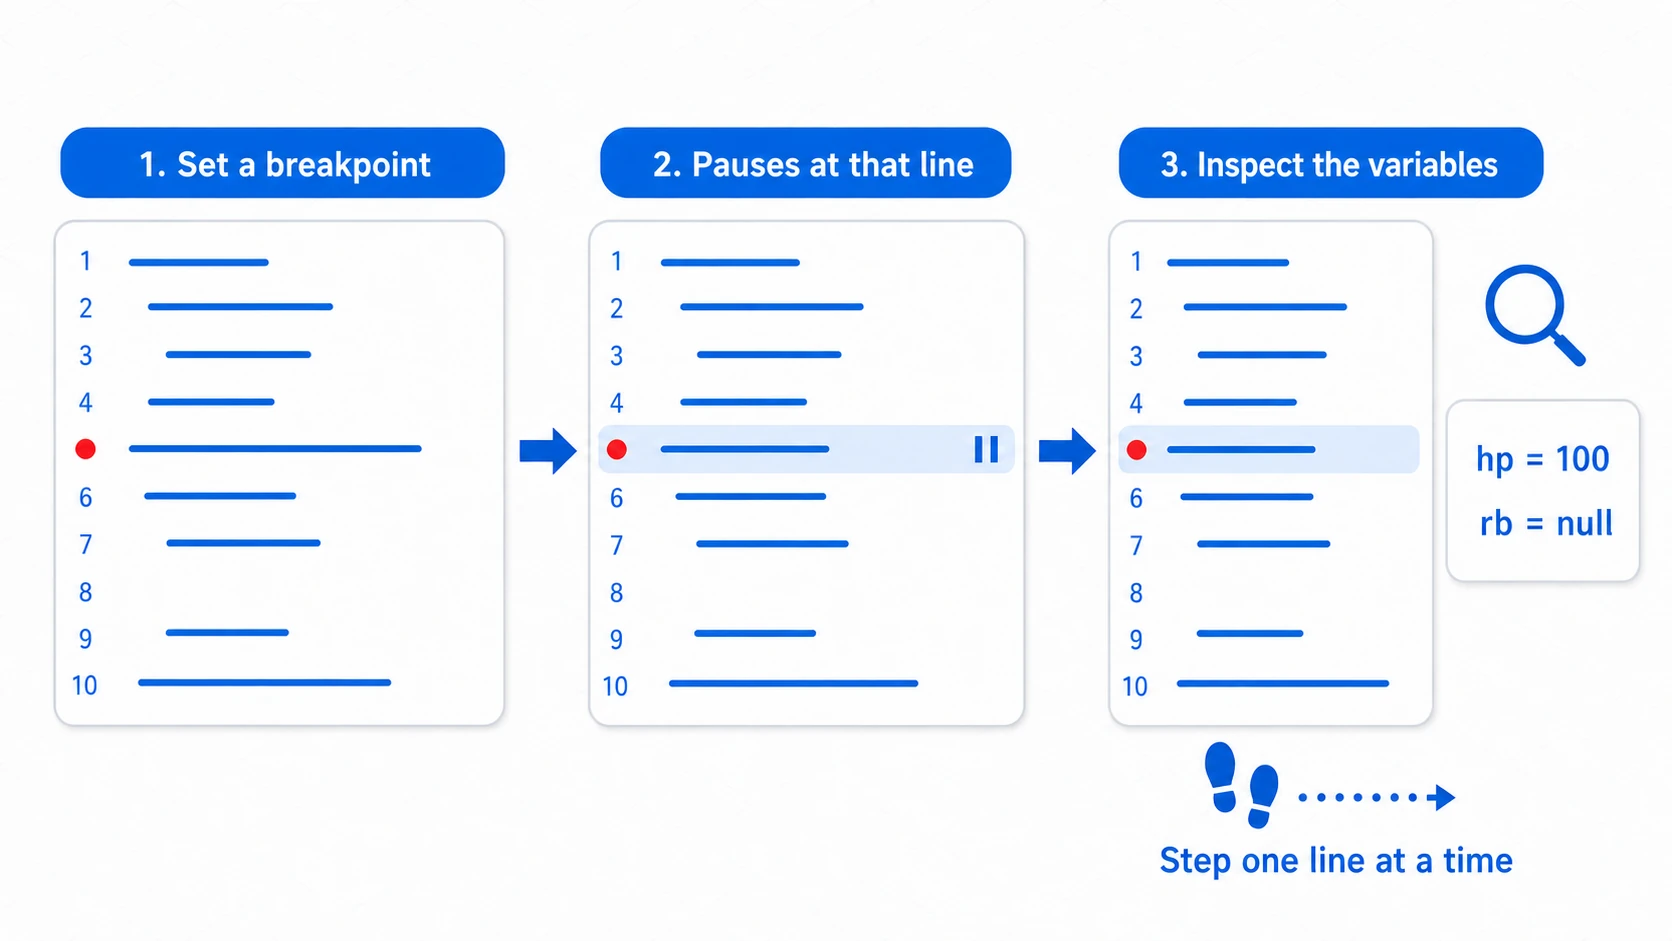
While paused, the Unity editor stops responding, which is normal (don't force-quit it). The debugger takes a little practice to master, but it's your most powerful weapon for cracking complex bugs.
Hands-On: Investigating "My Attacks Land but the HP Won't Drop"
That's it for introducing the tools. Now let's investigate a bug that comes up weekly in real development—the sword clearly hits the enemy, but the HP bar won't budge—as a proper case. Attacks in an action RPG, getting hit in a shooter, scoring in a puzzle game—the investigation procedure for any "the logic doesn't seem to arrive" bug is the same.
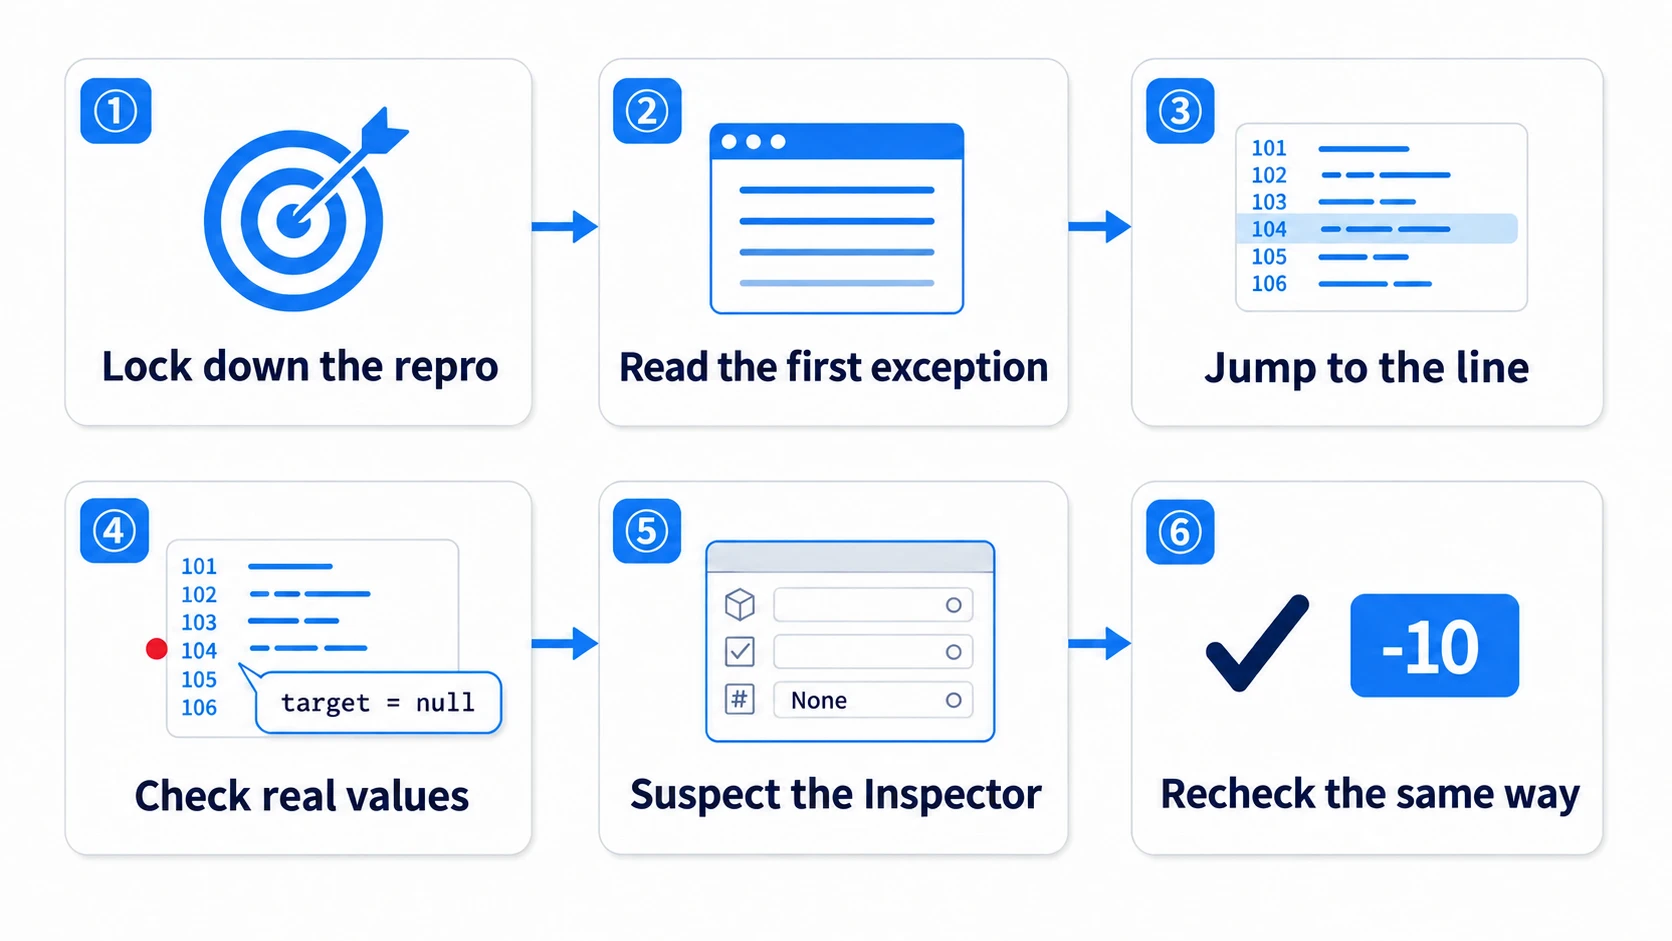
Instead of "scatter logs everywhere and stare," the professional procedure is to kill hypotheses one at a time with the cheapest tool available.
- Fix the reproduction steps: decide up front on the shortest sequence that triggers the bug every single time—"this enemy, from this position, one attack." If reproduction stays vague, you can't even judge whether your fix worked
- Read the FIRST exception in the Console: press Clear in the Console before reproducing; with multiple red errors, look at only the topmost (earliest) one—the rest are usually collateral damage. From the stack trace under
NullReferenceException: ..., double-click the topmost line that's your own code (e.g.EnemyHealth.TakeDamage () (at Assets/_Project/Scripts/EnemyHealth.cs:24)) - List the suspects on that line: if line 24 is
healthBar.SetValue(current);, the null suspect ishealthBar. Whatever sits to the left of each dot (.) in the line is your suspect list—this one reading habit finishes half of every NullReference investigation - Check real values with a breakpoint: set a breakpoint on the line, reproduce step 1, and look at the actual values of
damage,target, andhealthBar. The gap between "what you assumed" and "what it actually is" is your culprit - Suspect the Inspector settings: even with correct code, configuration culprits are just as common—the
healthBarslot saysNone(forgot to assign), the enemy's Layer isDefaultinstead ofEnemy. Pause during Play and inspect the actual object in the Hierarchy - After the fix, run the exact same steps: repeat step 1 verbatim and confirm "one attack takes off exactly 10." Verifying with different steps can make an unfixed bug look fixed
Narrowing Down When There's No Error
Bugs that throw red errors are actually the easy kind. The nasty ones are "no error, but the HP still won't drop." Same symptom, different culprits, different shortest routes:
| Symptom | Common culprit | Fastest tool |
|---|---|---|
| A red error appears | Unassigned healthBar or target (UnassignedReferenceException in the editor; NullReferenceException if you forgot to assign it in code) | Console → stack trace → the line |
| No error, and no HP change | A Layer mismatch on the attack means TakeDamage is never called | Breakpoint at the entry (not stopping means the culprit is upstream) |
| HP drops twice per hit | Double event subscription (+= in OnEnable, forgot -=), or the attacker has two Colliders that both hit | Count calls with Debug.Log → search for subscription sites |
The thing to remember: a breakpoint that never triggers is itself crucial evidence (provided you've first confirmed it stops on a line that always runs, such as the first line of Start). Put one on the first line of TakeDamage—if it doesn't stop, the culprit isn't inside this method but in the wiring that calls it (Layer, Collider, event registration). Your search area just got cut in half.
The real finale of the investigation isn't a fancy tool — it's step 6, "same steps, one more time." Jump from the error message to the line, peek at the actual values with a breakpoint, and finally watch the same attack take off exactly 10. Walk that path once with your own hands, and the next bug won't leave you wondering where to start.
Bonus: Good to Know for Later
Once you're comfortable with Debug.Log and the debugger, Unity has even more powerful visualization tools waiting for you.
- Draw shapes in the Scene view for debugging: Spatial information that's hard to grasp from numbers—like an enemy's detection range or a ray's trajectory—can be drawn directly in the Scene view with Gizmos. See our introduction to Gizmos.
- Pin down "why is it slow?" with real numbers: Don't investigate stuttering by guesswork—use the Profiler. It measures exactly how many milliseconds each operation takes. Our introduction to the Profiler is a good starting point.
- Move toward preventing bugs: Instead of checking things manually, you can automate checks with test code using the Unity Test Framework. Our introduction to the Test Framework will help you get started.
Summary
Debugging is a process of trial and error. The key mindset is not to fear errors, but to treat them as clues that lead you to the solution.
- Use
Debug.Logliberally: Check variable values and confirm which code paths run—it costs nothing. - Read error messages carefully: They're treasure maps that tell you what went wrong and where.
- Watch out for
NullReferenceException: Always be mindful of whether your objects and components are properly assigned and retrieved. - Give the debugger a try: When you hit a complex problem, use the debugger to peek inside your program.
Building these debugging skills will dramatically improve both your development speed and the quality of your work.