The Profiler article taught you to chase CPU spikes. Frame rate is fine. And yet — ten minutes on a real device and the app dies outright. You leave a stage and memory usage never comes back down. The phone heats up at every loading screen.
That's a problem of weight, not speed — the world of resident memory. This article walks the Memory Profiler package down a straight road: taking snapshots, the before/after comparison ritual that exposes squatting memory, and thinking in per-device memory budgets.

What you'll learn
- Triage: GC spikes (stutter) vs. resident memory (weight and crashes)
- Installing Memory Profiler and taking snapshots (attached to a device)
- Reading textures, meshes, and AudioClips in the Unity Objects view
- Exposing what survives a scene unload with before/after comparison
- Thinking in memory budgets derived from real devices
- Hands-on: recovering 100 MB from a stage that crashes on device
Tested with: Unity 6 (6000.x), Memory Profiler 1.1
- GC spikes and resident memory are different diseases
- Install Memory Profiler, take a snapshot
- Reading it: what's eating the space
- Before/after: exposing what survives
- Memory budgets: work backward from the device
- Hands-on: recover 100 MB from a crashing stage
- Bonus: things worth knowing early
- Summary
GC spikes and resident memory are different diseases
Memory problems split into two kinds. Symptoms, tools, and cures all differ, so triage comes first.
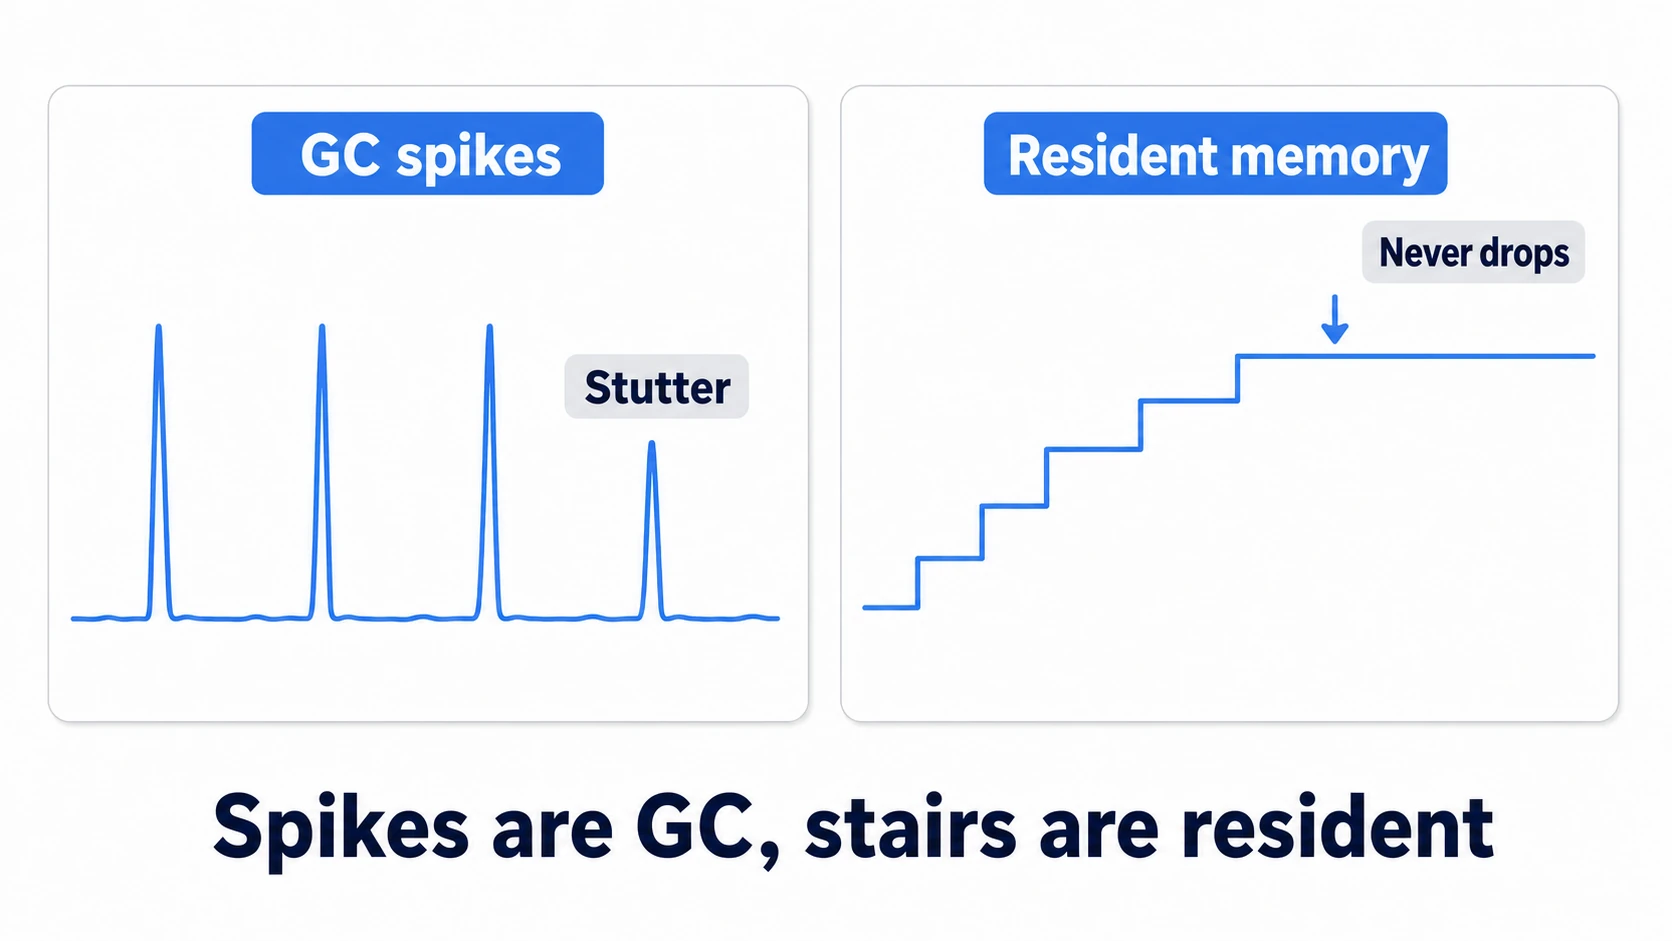
- GC spikes: short-lived garbage born and discarded every frame (string concatenation, scattered
new) piles up until collection freezes a frame. The tool is the regular Profiler; the cure lives in the GC optimization article - Resident memory: textures, meshes, and audio that load and stay. Symptoms: overall heaviness, slow loads, and on mobile, the OS silently killing the app — often with no crash log at all. It shows up in the worst possible way: only on device, only after you've forgotten about it
This article hunts the second kind. Stare at frame-rate graphs all day and resident memory stays invisible. You need the dedicated tool.
Install Memory Profiler, take a snapshot
Add Memory Profiler from the Package Manager (Unity Registry), then open it via Window > Analysis > Memory Profiler.
If the regular Profiler is a movie of every frame, the Memory Profiler is a photograph of everything in memory at one instant (a snapshot). Three steps:
- Run a Development Build on device and attach: enable Development Build, build, launch on the device, then pick the device's Player — not the Editor — in the Attach to Player dropdown at the top of the Memory Profiler window
- Press Capture: the snapshot saves after a few seconds
- Capture per scene of interest: one at the title screen, one in the heavy stage, one after returning — comparison is this tool's real body, so shooting "before and after" is the default motion
Note: numbers measured against the Editor are not meaningful. The Editor holds editor-side data and Scene-view resources several times the size of your actual game. For "it crashes on device," always attach to the device's Player.
Reading it: what's eating the space
Open a snapshot and check the Summary view first. In most games, the usual suspects are:
| Item | Contents | Tendency to bloat |
|---|---|---|
| Texture2D | Textures: UI, sprites, model art | ★★★ (the prime suspect) |
| Mesh | 3D model geometry | ★★ |
| AudioClip | Music and SFX | ★★ (settings change everything) |
| Managed Heap | C# objects (Lists, class instances) and its free space | ★ (where leaks nest) |
| Graphics / RenderTexture | Rendering buffers | ★ |
Then switch to the Unity Objects view and sort by size, descending. That's the basic posture of every memory investigation — the top ten heavyweights decide the case, not the hundreds of trinkets. One uncompressed 2048×2048 texture is about 16 MB; the same image with proper compression (ASTC on mobile) fits in a few. Just reading the names and sizes at the top starts the discoveries: "wait, this title logo is still 4K."
Before/after: exposing what survives
The Memory Profiler's real power is comparing two snapshots (Compare Snapshots). The question you want to ambush is: "I left the stage — why didn't memory come back?"
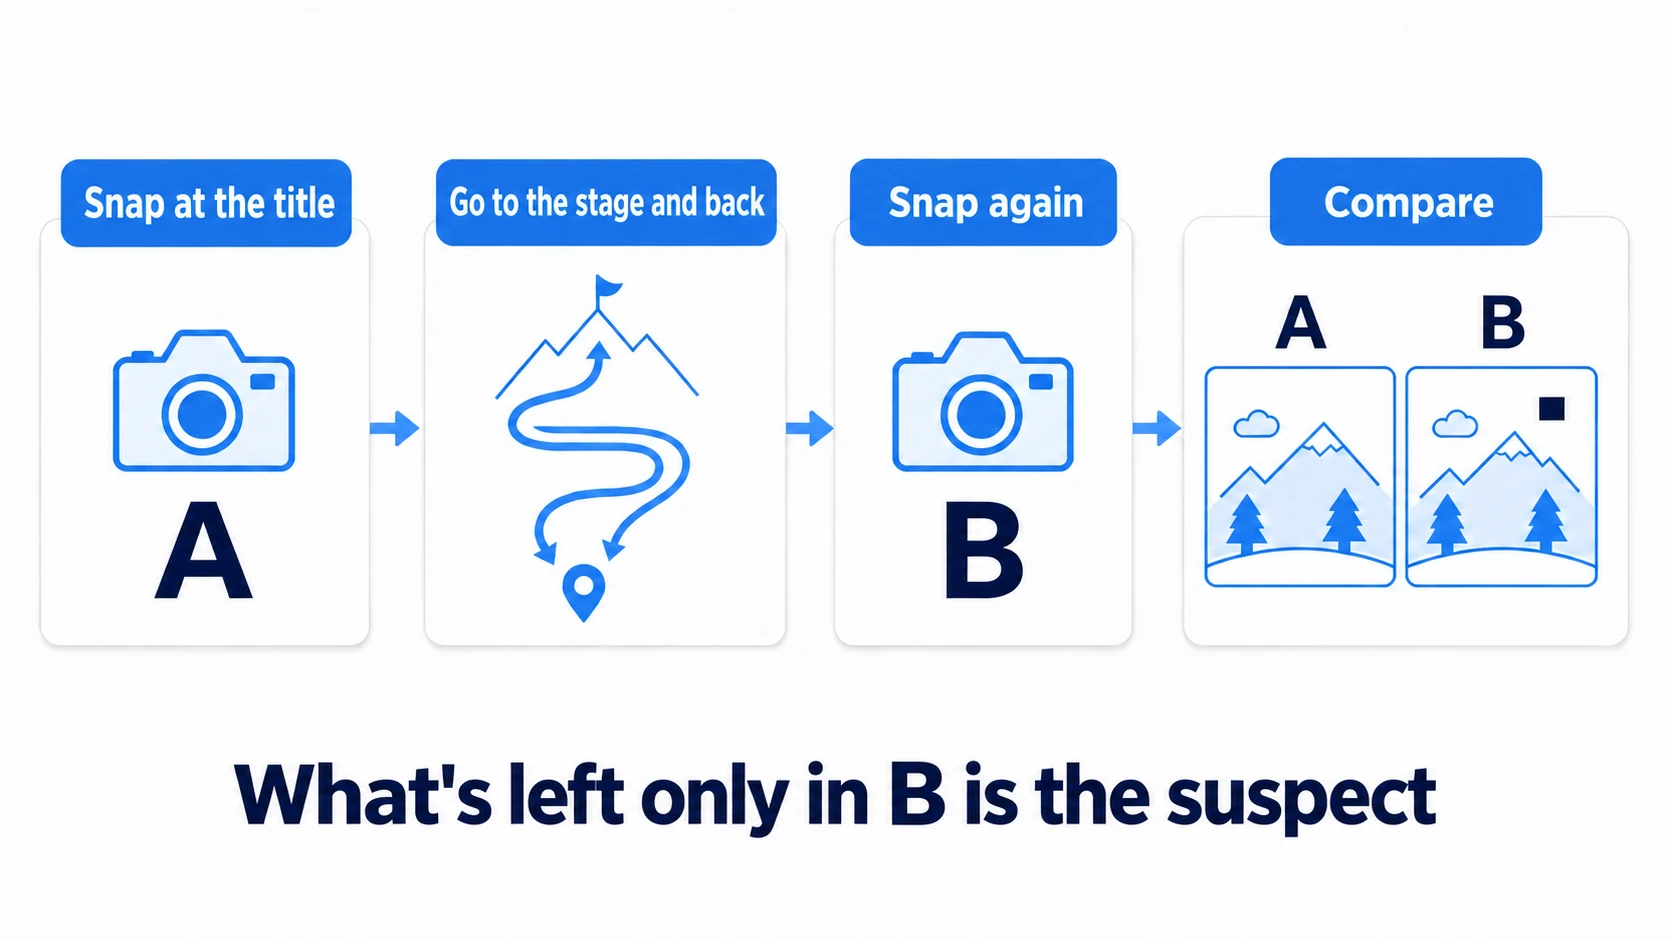
Fix the procedure like a ritual.
- Take snapshot A at the title screen
- Enter the heavy stage, play a while, return to the title
- Wait a few seconds after returning (until the scene has finished cleaning up), then take snapshot B
- In the Snapshots panel on the left of the Memory Profiler, switch from Single Snapshot to Compare Snapshots, pick the two, and inspect the difference
In theory A and B are the same title screen, so their contents should match. Whatever exists only in B is your list of suspects — things that were never released when the scene unloaded. If the stage boss's texture is still squatting at the title screen, something is holding it. Four usual culprits:
- References in static fields: enemy data left in a forgotten
static List<Enemy> - Event subscriptions never removed: a destroyed UI still reachable through a static event, indirectly pinning assets (the events article's unsubscribe rule is also a memory rule)
- DontDestroyOnLoad objects: legitimately persistent objects dragging stage-only assets along with them
- Unreleased Addressables: handles that broke the "borrow it, return it" rule
Select a suspect in the comparison and you can trace what references it in the Referenced By tab of the References panel on the right. Once you know who's holding it, the fix is a straight line.
Memory budgets: work backward from the device
Leaks plugged, the next question is "how many MB is acceptable in the first place?" The answer only exists on the device side. Mobile OSes kill apps without warning when memory tightens — unlike PC, "heavy but running" doesn't exist there.
The practical method: pick one lowest-spec target device, measure the ceiling that doesn't crash on it, and distribute that ceiling across categories.
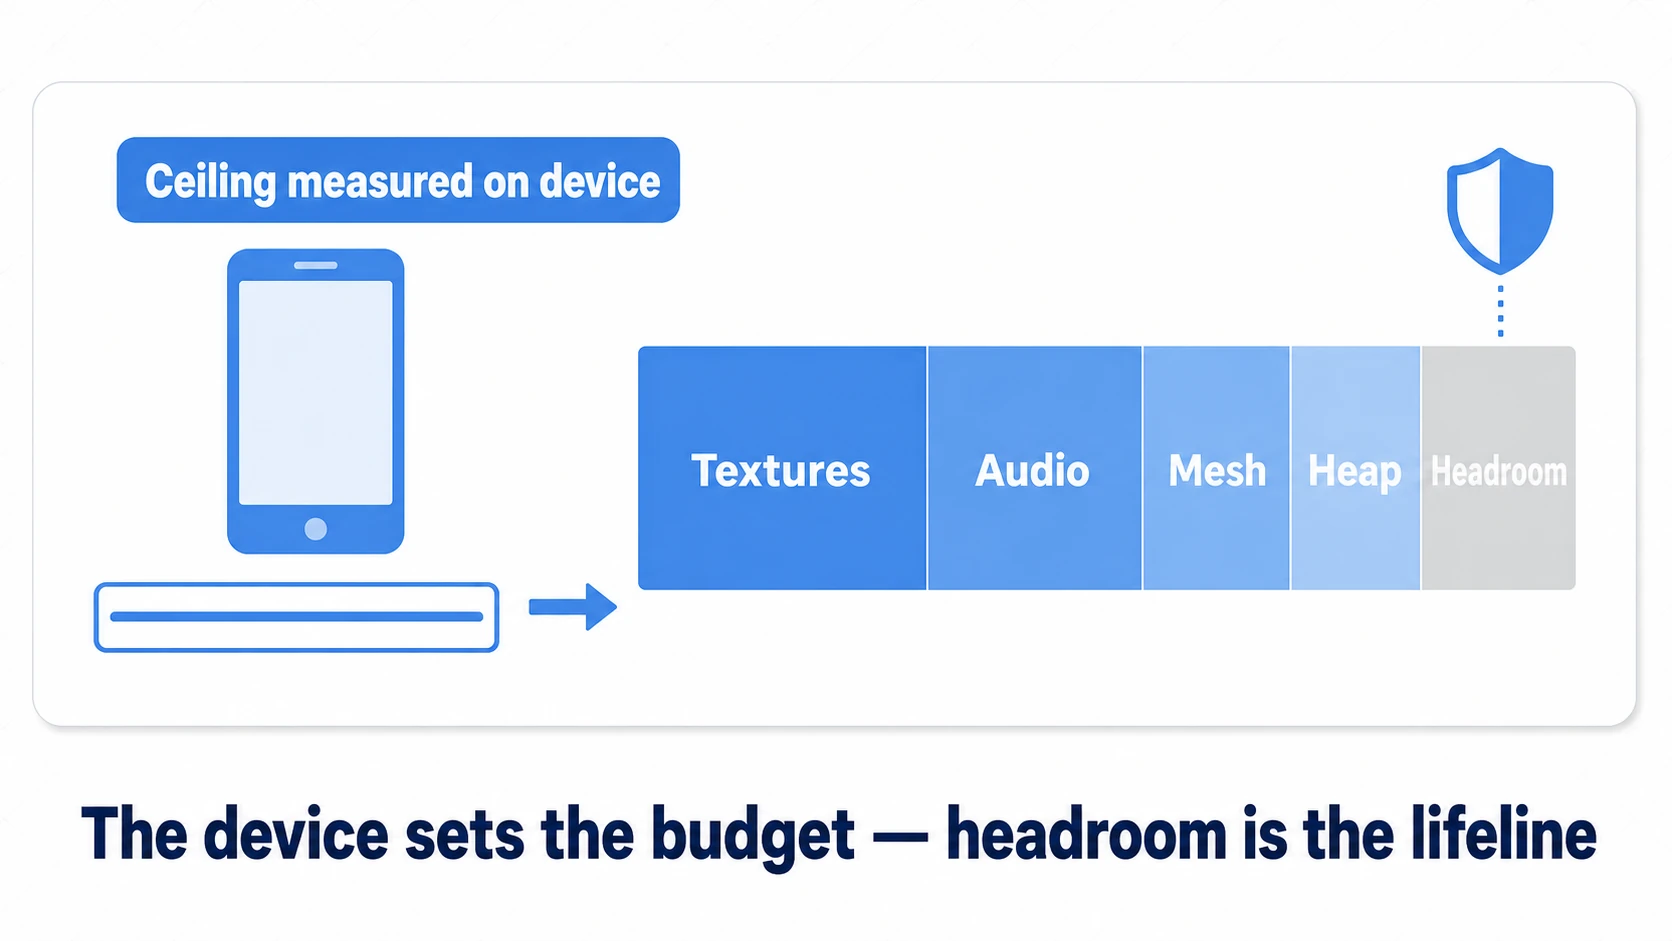
The exact split depends on your game, but the principles don't:
- The biggest wallet goes to textures (which are also the easiest to shrink — resolution and compression settings cut them to fractions)
- Always keep headroom: scene transitions momentarily hold old and new assets at once. A design that spends the full budget dies exactly at the loading screen
- Run the budget with a checklist: snapshot on the same device, same procedure, same scene, and log numbers before and after each fix. Measure differently each time and you'll never know improvement from noise
Hands-on: recover 100 MB from a crashing stage
A fictional case that happens somewhere every day: "only stage 3 crashes, and only on older devices." Frame rate is normal. Logs show nothing — a textbook resident-memory crime scene.

- Attach to the device Player, snapshot right before and right after stage 3. The after-Summary shows Texture2D at 60% of everything
- Unity Objects view, size descending. At the very top: an unfamiliar
BG_Stage3_Skyat 48 MB — 4096×4096, left uncompressed (RGB24). Runner-up: a nearly identicalBG_Stage3_Sky_old(an unused legacy version, still referenced, still loaded) - Fix the import settings: a sky doesn't need 4096, so 2048; compression to ASTC; mipmaps off if it's UI-facing. Cut the old version's reference entirely. Those two files alone return about 90 MB
- Snapshot again with the identical procedure and Compare: watch the Texture2D total drop, and confirm with your eyes that the deleted legacy version is truly gone
- Run stage 3 three laps on the device, no crash. Log it — "before 348 MB → after 251 MB, three laps clean" — case closed
Two takeaways. Always investigate in descending size order (suspecting the top ten solves most cases). Verify with the same device and the same procedure (only consistent measurement turns numbers into evidence).
Bonus: things worth knowing early
- AudioClips transform with one setting: a long BGM with Load Type set to
Decompress On Loadsits fully decompressed in memory (tens of MB). BGM belongs onStreaming - Watch "merely loaded" Resources: assets from
Resources.Loadcan linger after references drop, untilResources.UnloadUnusedAssets()(run automatically when you switch scenes withLoadSceneMode.Single). If you load big assets by hand, plan to clean up by hand - Texture budgets are per-platform: import settings support per-platform overrides, letting you cut resolution and compression for mobile only — keeping PC visuals while fitting the mobile budget. More in the mobile optimization article
Summary
- Stutter is GC spikes; device heaviness and crashes are resident memory. Different diseases, different tools
- The Memory Profiler takes photographs (snapshots) — always attached to a real device's Player
- Reading starts with Unity Objects, sorted by size. The prime suspect is almost always textures
- Before/after comparison exposes what survives: static references, missed unsubscribes, DontDestroyOnLoad, unreleased Addressables
- Budgets come from measuring the target device, keeping headroom, and comparing before/after with a fixed checklist
Your game's heaviest scene: can you name what's in its top ten Texture2D entries right now? If not — start by taking one snapshot.