Your game stutters. You try removing objects, commenting out chunks of Update(), turning off shadows — and it still isn't fixed. This "delete things at random and hope" approach fails because you're hunting for the culprit by guesswork.
The golden rule of performance optimization fits in one line: "Don't guess — measure." And the measuring tool for the job ships with Unity: the Profiler.

What You'll Learn
- How to approach optimization — the measure → identify → fix → re-measure loop
- Profiler basics (Record, selecting frames)
- How to read the CPU Usage module — finding culprits with Time ms, Self ms, and the GC Alloc column
- Common patterns of expensive work and the articles that cover each fix
- How to do on-device profiling (Development Build)
Tested with: Unity 6 (6000.x)
The Golden Rule: Don't Guess — Measure
Optimization works as a loop.
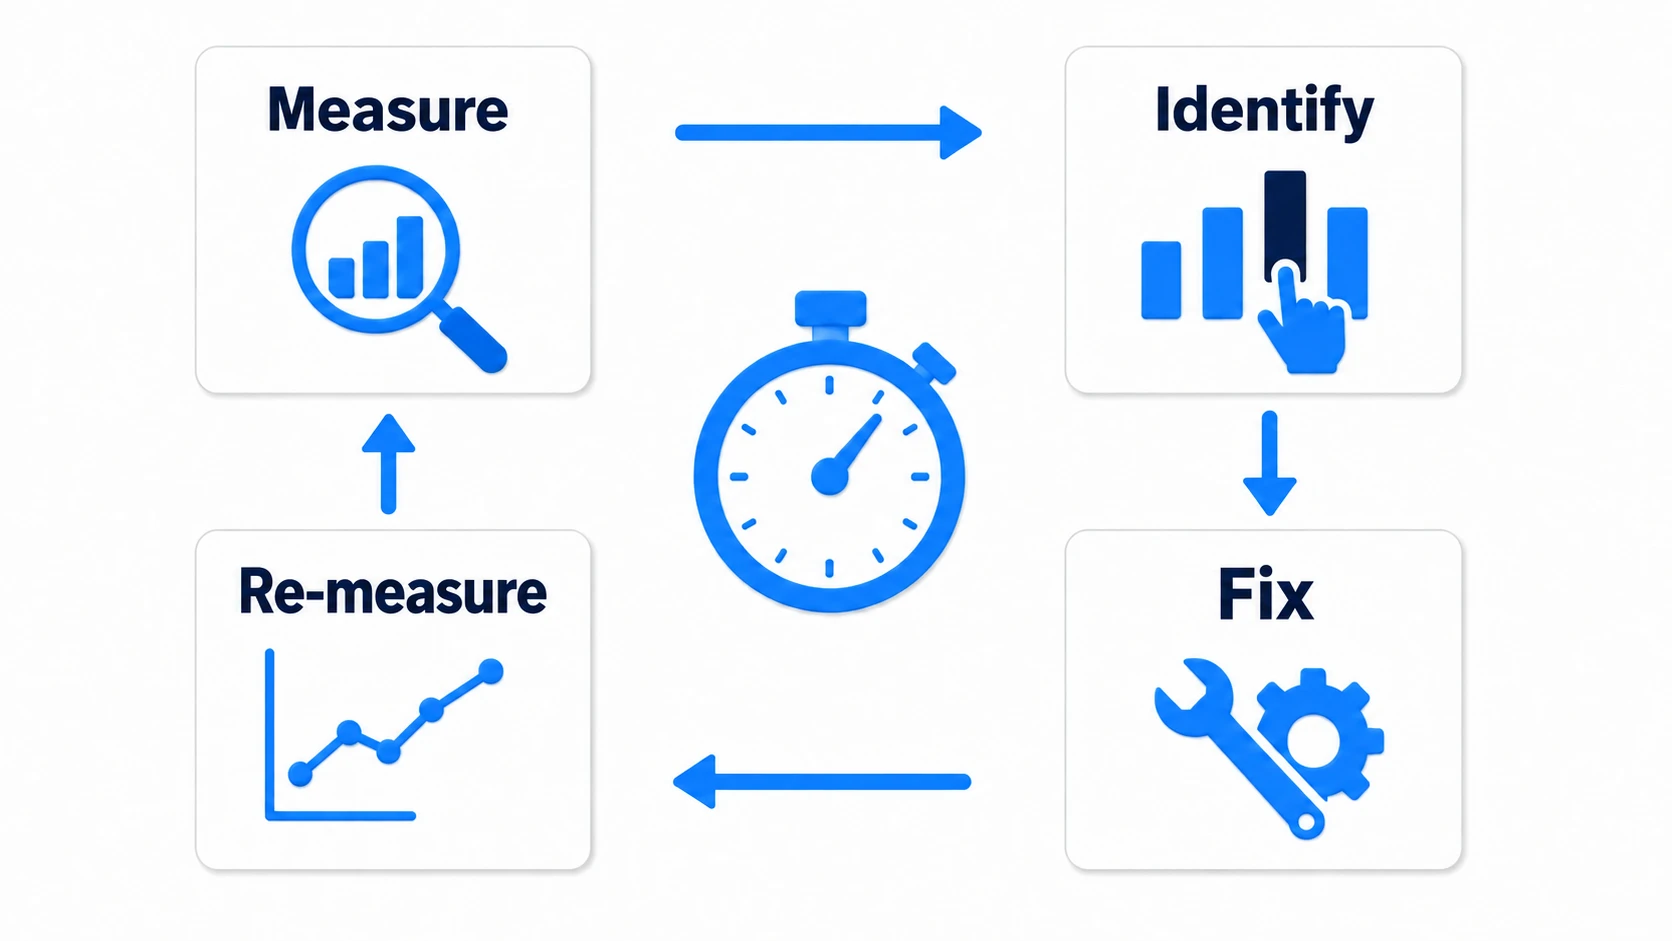
- Measure: Record with the Profiler and find spikes (tall peaks in the graph)
- Identify: Pin down the process eating the most time in that frame
- Fix: Change only the single heaviest spot
- Re-measure: Confirm the improvement with numbers
The key is to fix only one thing at a time. If you fix several things at once, you can't tell which change helped (or which one made things worse). Also, no matter how much you speed up something that only accounts for 1% of the frame, the game won't feel even 1% faster. Always start with whatever is heaviest right now.
Profiler Basics
- Open it: Choose "Window > Analysis > Profiler" from the menu (shortcut:
Ctrl + 7). - Record: With the "Record" button enabled, play the game and the graph starts scrolling in real time.
- Select a frame: On the graph, click the spike (tall peak) at the moment the game stuttered. The breakdown of that frame's work appears in the lower part of the window.
tips When scanning the graph, look at the color legend first. The colors making up a spike (Scripts = light blue means code, Rendering = green means drawing, GarbageCollector = brown means GC cleanup; yellow is VSync waiting, so it isn't the culprit) narrow down the culprit's category at a glance.
CPU Usage — Where the Manhunt Happens
When investigating stutters, start with the CPU Usage module. After clicking the spiking frame, switch the lower view to Hierarchy.
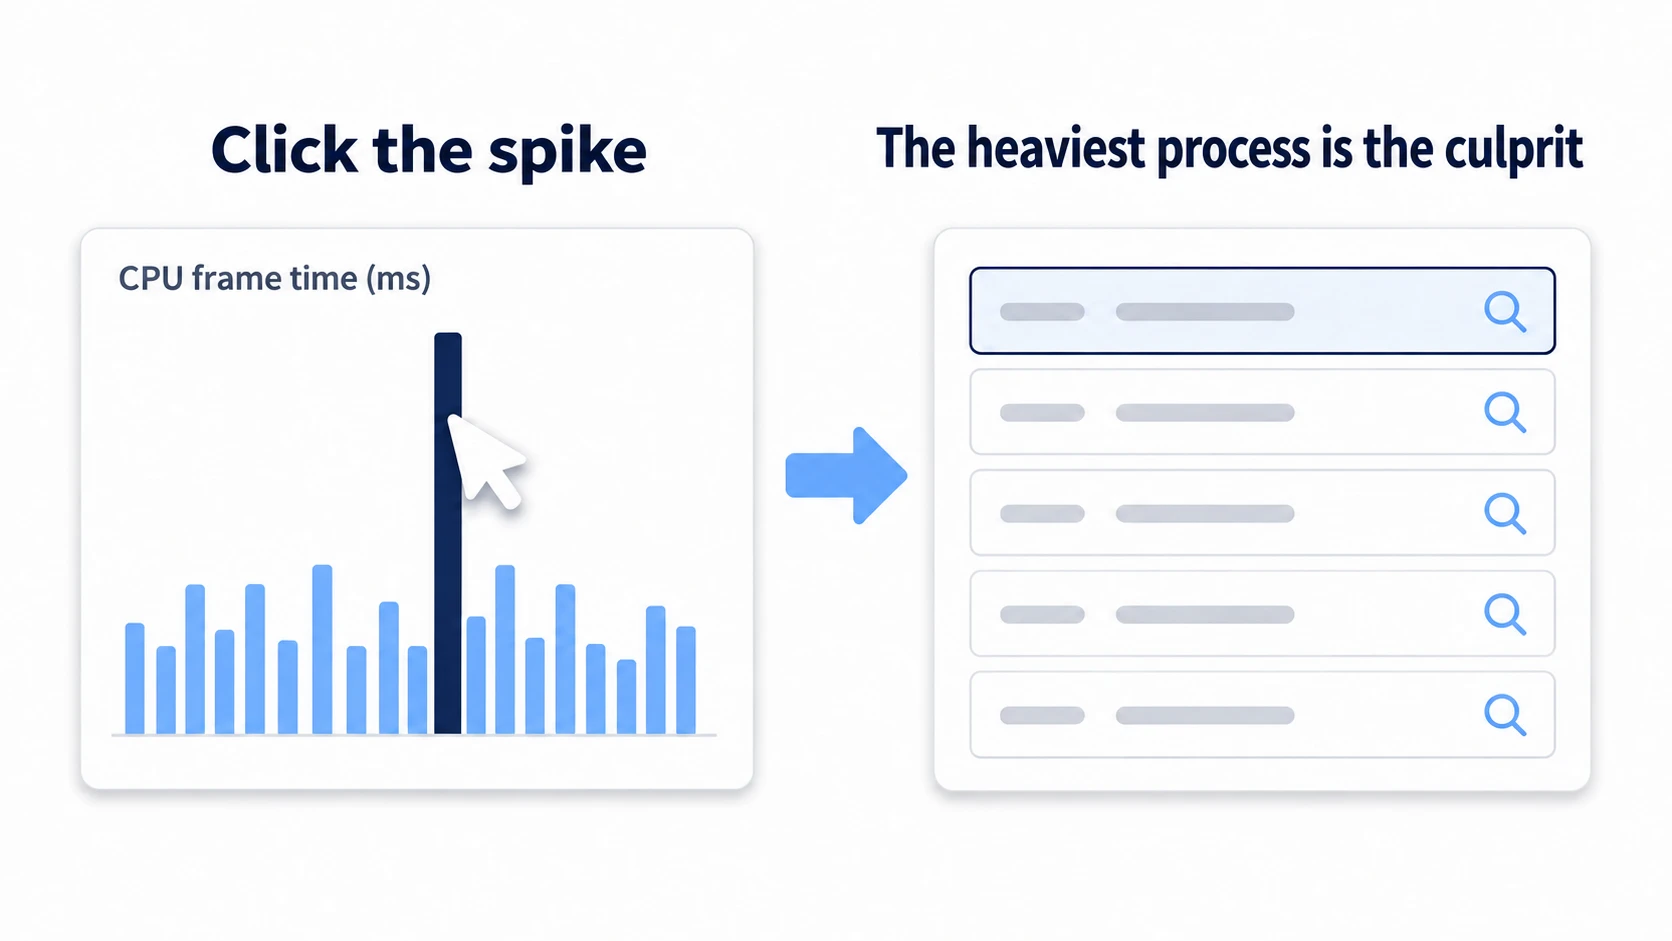
Every process executed in that frame is shown as a hierarchical list. You only need three columns.
| Column | Meaning | How to use it |
|---|---|---|
| Self ms | Time spent in that process itself | Once you've expanded down, the row where this is large is your culprit |
| Time ms | Total time including child processes | Sort descending and expand the largest rows |
| GC Alloc | Heap memory allocated in that frame | Nonzero every frame means fuel for GC spikes |
The routine is always the same: "Click the spike → open Hierarchy → expand the rows with large Time ms → suspect the row with a large Self ms at the end." If you only sort by Self ms, parent rows that hand their time to children look small, and you miss the entrance to the heavy work. Your own scripts show up under names like ScriptName.Update(), so expand the hierarchy to drill down to the specific method.
tips To measure a specific section of your own code, wrap it in
UnityEngine.Profiling.Profiler.BeginSample("EnemyAI")andProfiler.EndSample(). It shows up in the Hierarchy as a named row called "EnemyAI", letting you narrow things down to "which part of Update is actually slow."
Common Bottleneck Patterns
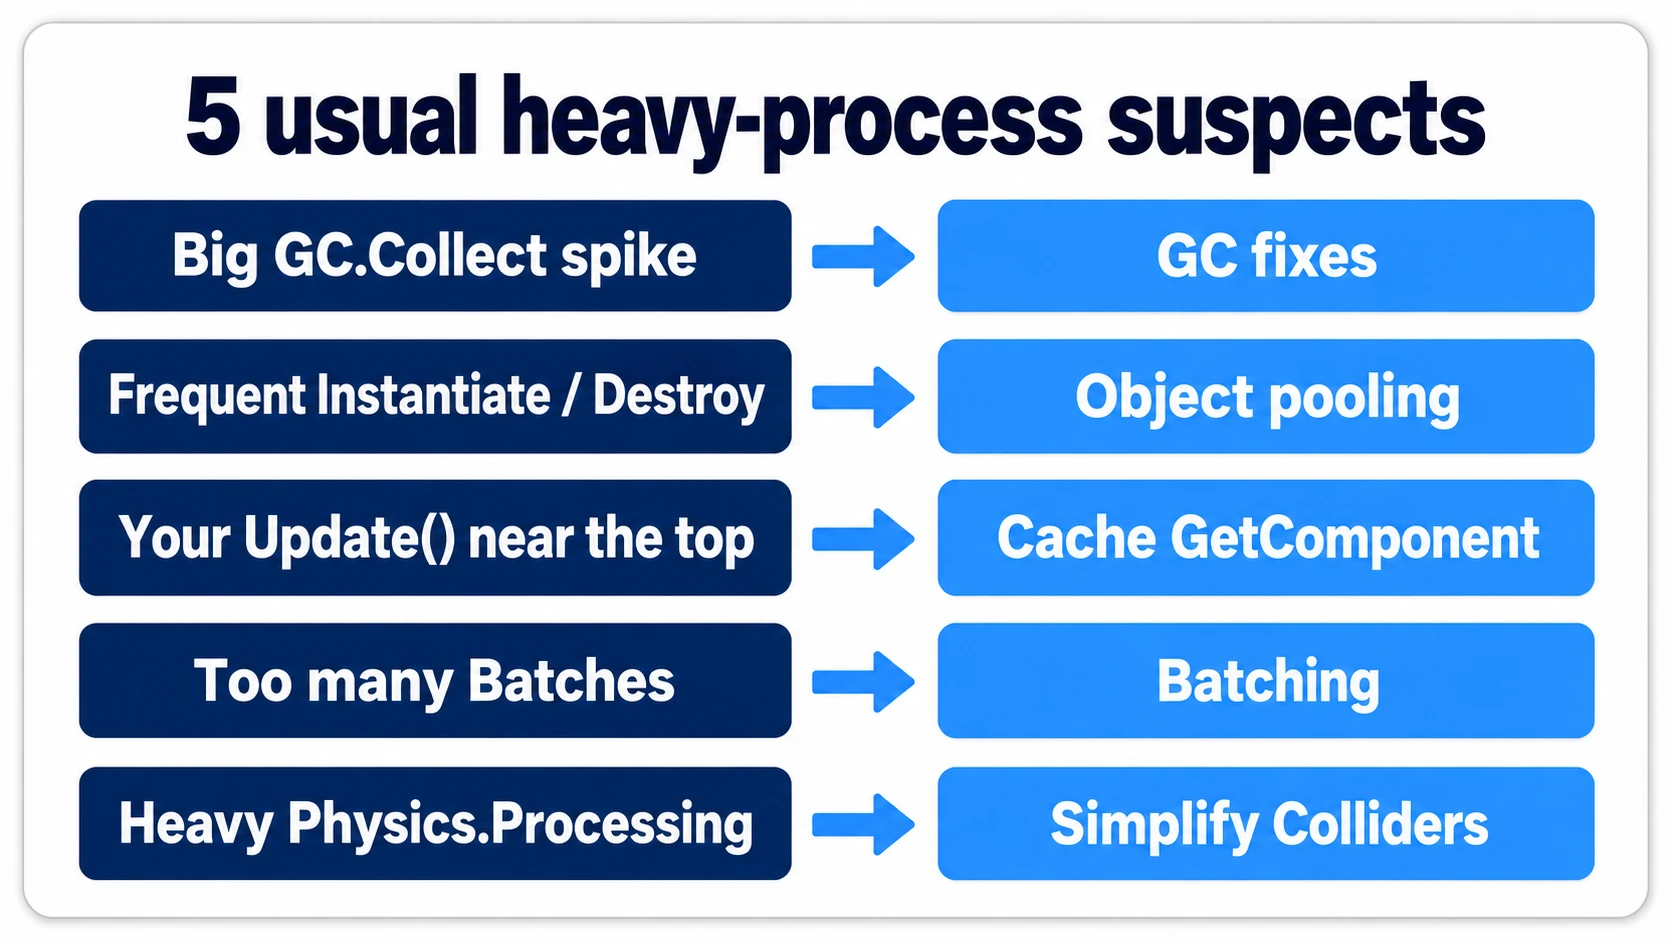
Here are the "usual suspects" that frequently top the Hierarchy, along with the articles covering each fix.
| What it looks like in the Profiler | Culprit | Fix |
|---|---|---|
Huge GC.Collect spikes | Per-frame heap allocations | GC optimization |
Frequent Instantiate / Destroy | Mass spawning/destroying of bullets, enemies, effects | Object pooling |
Your own script's Update() near the top | GetComponent in loops, expensive searches, per-frame string work | Caching GetComponent |
Heavy Camera.Render, many Batches in the Rendering module | Too many draw calls | Draw calls and batching |
Heavy Physics.Processing or Physics.Simulate | Too many Colliders, overuse of Mesh Colliders | Simplify collision shapes, revisit your FixedUpdate settings |
Practical: Hunting Down and Killing a GC Spike
Let's run through everything so far on a case you'll actually hit. "A periodic stutter, once every few seconds"—a textbook GC-spike symptom that plagues shmups and RPGs alike.
- Measure: Turn on Record, play, and click the red spike at the moment it stutters.
- Identify: Open Hierarchy and
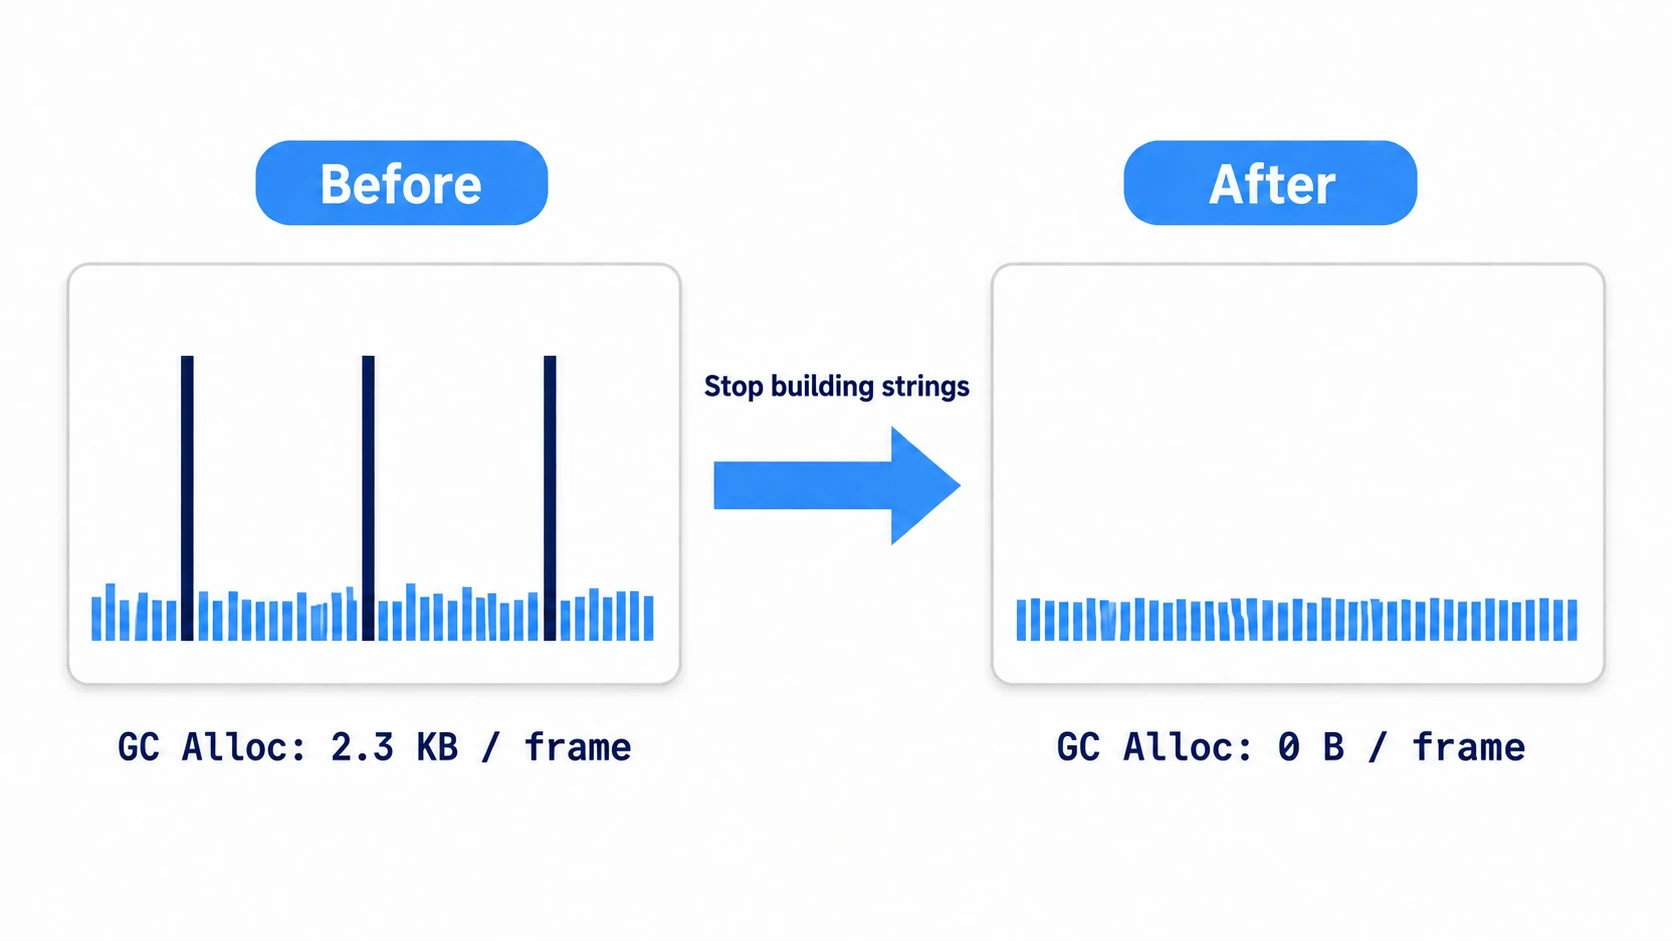
GC.Collectis hogging tens of milliseconds. Unity 6 has Incremental GC on by default, so cleanup is normally split into small pieces over several frames, but when garbage piles up faster than it can keep up, you get a big spike like this. ButGC.Collectis "the moment of cleanup," not the true culprit. Sort by the GC Alloc column and expand the largest rows, and there it is—ScoreUI.Update()was allocating2.3 KBevery frame. The contents: a"Score: " + scorestring concatenation. - Fix: Stop generating a string every frame. Just update
textonly when the score changes (make it event-driven) and this allocation drops to zero. - Re-measure: Record the same scene and confirm with numbers that GC Alloc is now
0 Band the periodic spikes are gone.
There are two key points.
GC.Collectisn't the culprit—it's the "result": Staring at the spike row itself won't fix anything. The right way to track it down is to hunt in the GC Alloc column for "the thing allocating every frame" (the mechanism is covered in the GC optimization article).- The go-to fix is "call it less often": Rather than speeding up the string concatenation itself, it's more effective to question "does this really need to happen every frame?" Updating only when the value changes is also the doorway to event-driven design.
Profiling on a Real Device
Measurements in the Editor are rough estimates, because the Editor's own overhead gets mixed in. They're fine for spotting trends, but the final call on "does it actually hit the frame budget?" must always happen on a real device. This matters especially on mobile, where the CPU/GPU performance balance is completely different from a PC.
- In "File > Build Profiles" (formerly Build Settings), enable "Development Build" and "Autoconnect Profiler", then build.
- Launch the game on the device, and its data streams into the Profiler in the Editor over the same network (or a USB connection).
- If it doesn't connect, pick the device directly from the target selection dropdown near the Record button at the top of the Profiler window (it shows Play Mode at first).
Other Modules
- Rendering: Shows draw calls (Batches, SetPass Calls) and polygon counts. Your entry point when rendering is the bottleneck.
- Memory: Shows overall memory usage. To dig into "which texture or asset is eating memory," the Memory Profiler package introduced in the bonus section is far more powerful. How assets end up in memory in the first place is covered in the asset management article.
- GPU Usage: Measures time spent on the GPU (unavailable on some platforms). If trimming CPU work doesn't change your frame rate, you may be GPU bound.
Bonus: Good to Know for Later
- Deep Profile: A mode that records every single method call. It pinpoints culprits precisely, but the measurement itself becomes extremely heavy and skews the numbers, so it's best used briefly — "turn it on for a moment to see the structure."
- Frame Debugger: "Window > Analysis > Frame Debugger". Lets you replay a single frame's rendering one draw call at a time, and even tells you why batching was broken. Your best friend for rendering optimization.
- Memory Profiler package: A separate tool installable from the Package Manager. It takes memory snapshots and lets you check "what's occupying how much" in a list. This is the go-to for investigating out-of-memory crashes.
- Profile Analyzer: An official package for statistical comparison across multiple frames. It lets you compare "before vs. after a fix" using averages, making your re-measurements more reliable.
- When memory keeps growing: compare Memory Profiler snapshots to see what stays in memory (Memory Profiler)
- If the computation itself turns out to be heavy: heavy number-crunching repeated many times can be split across CPU cores with Jobs and Burst (A Jobs + Burst Primer)
Summary
- Don't fix by guesswork. Follow the measure → identify → fix → re-measure loop, one change at a time.
- The basic stutter-hunting routine is "click the spike → Hierarchy → expand by Time ms → Self ms at the end."
- A value showing up in the GC Alloc column every frame is an early warning of a GC spike.
GC.Collectis the result, not the culprit. - Make the final call with a Development Build on a real device. Editor numbers are estimates.
- The common patterns (GC, Instantiate, draw calls) each have a well-established fix.
The Profiler isn't a tool you "open and stare at" — it's a tool that points at the culprit for you. When the game feels slow, open it before you start deleting things.