You add one Print String, then two, then three, and soon the graph is full of log nodes. Even then, the text scrolling past is too fast to read the one thing you need: what the value actually was at that moment.
This is where Blueprint Debugger comes in. Instead of scattering logs and reading the trail afterwards, it's a tool that stops execution on the spot so you can look at the values directly, and it shines after the "three questions" from debugging with Print String have narrowed you down to a suspicious area. This article covers how to set breakpoints, when to use each of the three step operations, and how to pick which of ten identical enemies you're watching.

What You'll Learn
- When to use Print String and when to use the debugger: follow the trail or stop on the spot
- How to set breakpoints and what you can see once execution stops
- Choosing between Step Into / Over / Out
- Using Debug Object to focus on "this one out of ten"
- Hands-on: stopping, finding, and fixing a "damage is always zero" bug
Print String vs. the Debugger
Both are debugging tools, but they have completely different personalities.
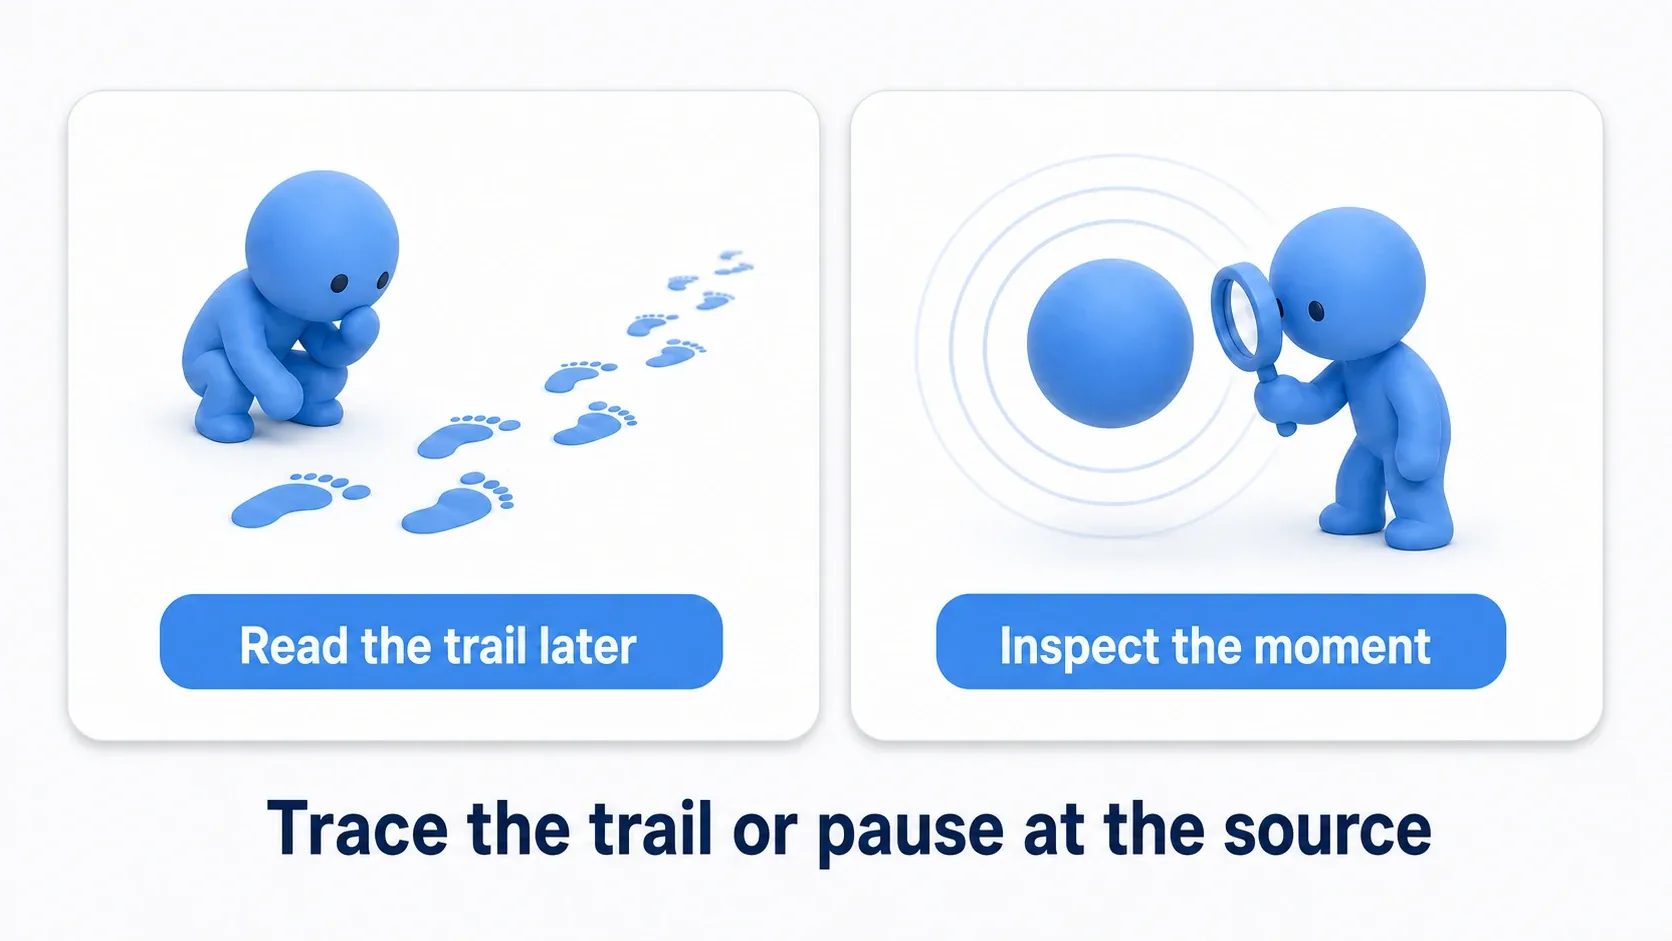
| Print String | Blueprint Debugger | |
|---|---|---|
| What it does | Leaves footprints along the path for you to read later | Stops execution so you can see the values at that moment |
| Good at | Answering "did this get called" and "roughly what value." Lets you observe while the game keeps running | Following one node at a time and inspecting values closely |
| Bad at | Unreadable once there's a lot of output. Can't follow what happens within a single frame | Execution stops, so the flow of the game is interrupted |
The rule is simple: use Print String until you've narrowed down the location, then switch to the debugger.
That said, keep in mind that the debugger isn't always the better tool. Bugs that depend on rapid input, UI focus, or timing can stop reproducing entirely, because pausing changes the conditions themselves. If you hit a bug that disappears when you stop, go back to logs without hesitation.
Setting Breakpoints to Stop Execution
The first step in debugging is placing a breakpoint on the node where you want to stop.
- Set it: Select the node you want to stop at and press
F9(or right-click and choose "Toggle Breakpoint"). A red circle appears at the node's top-left when it's set. You can only place them on nodes with execution pins (function calls, Set, Branch, and so on), not on pure calculation nodes like addition or Get - Run it: Start PIE (Play In Editor) as usual
- Stop: The instant execution reaches that node, the Blueprint pauses and the Blueprint editor comes to the front
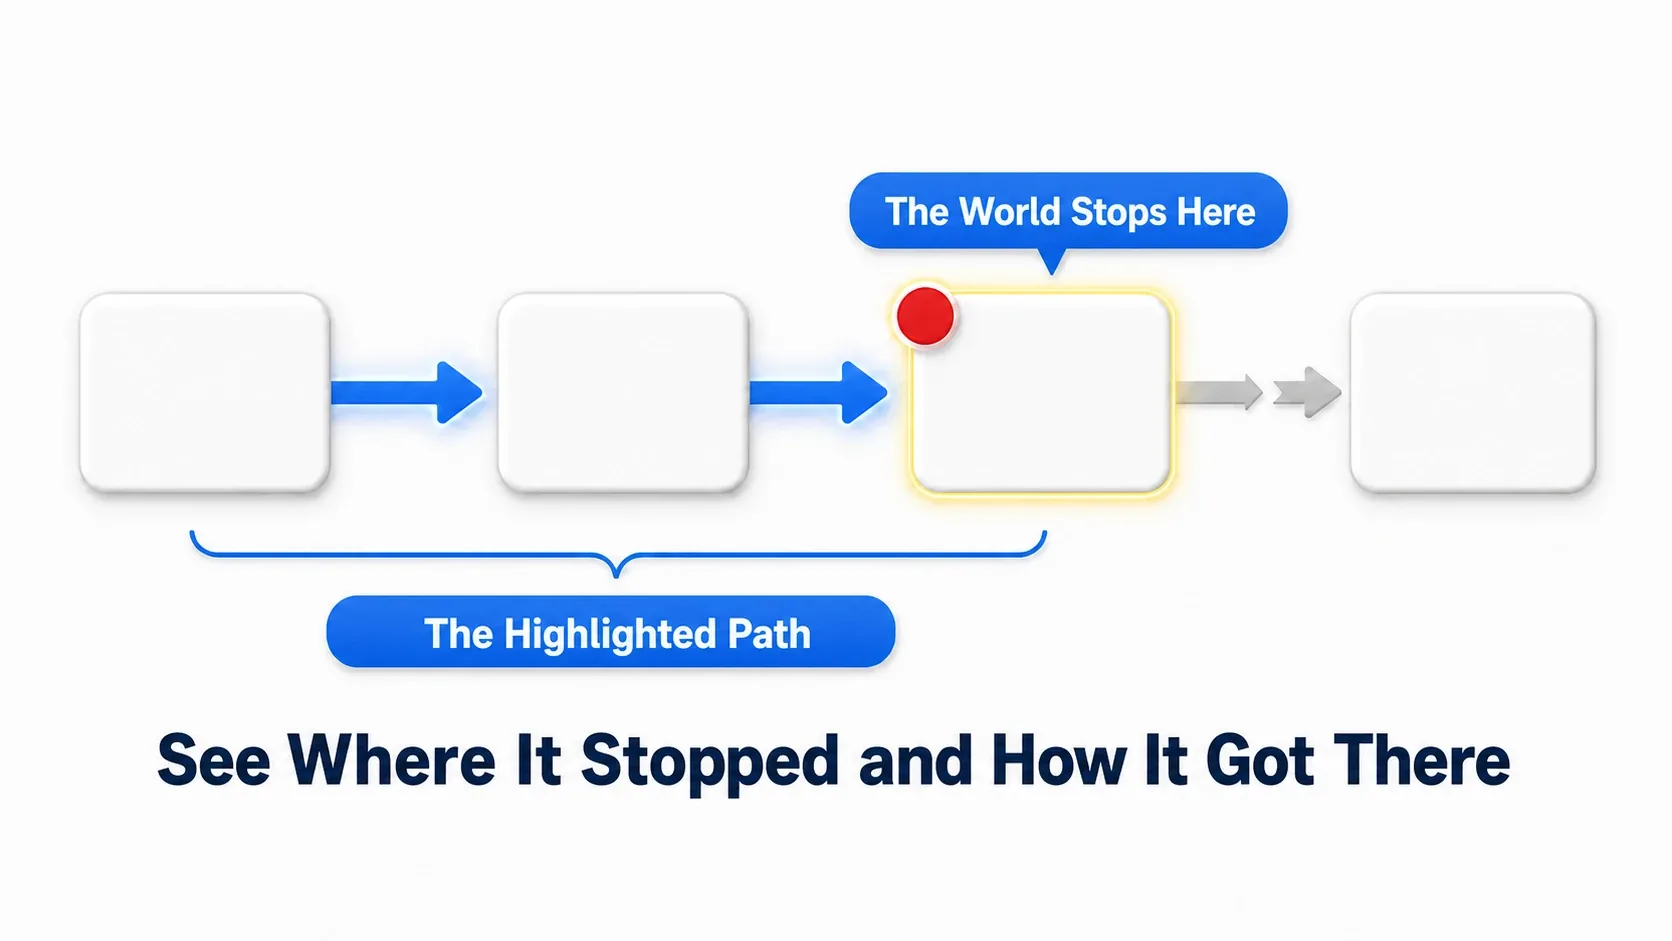
The stopped node is highlighted with a glowing border, and the execution wires you traveled to get there are colored too. "I was going down a different branch than I thought" is enough to solve a surprising number of bugs on its own. Time is frozen while you're paused, so take your time looking at the values.
If the red circle turned yellow: That breakpoint is disabled. The usual cause is forgetting to compile, so compile first. Hover over the icon and it shows the reason.
The Blueprint Debugger window: Open it via
Tools → Debug → Blueprint Debugger(also available from theDebugmenu at the top of the Blueprint editor), and you get a single view with your current breakpoint list, watched values, and the call stack. Breakpoints work without this window open, so open it only when you need it.
Stepping: Into, Over, and Out
Once you're stopped, you advance one node at a time and observe. Step operations only work while paused at a break.
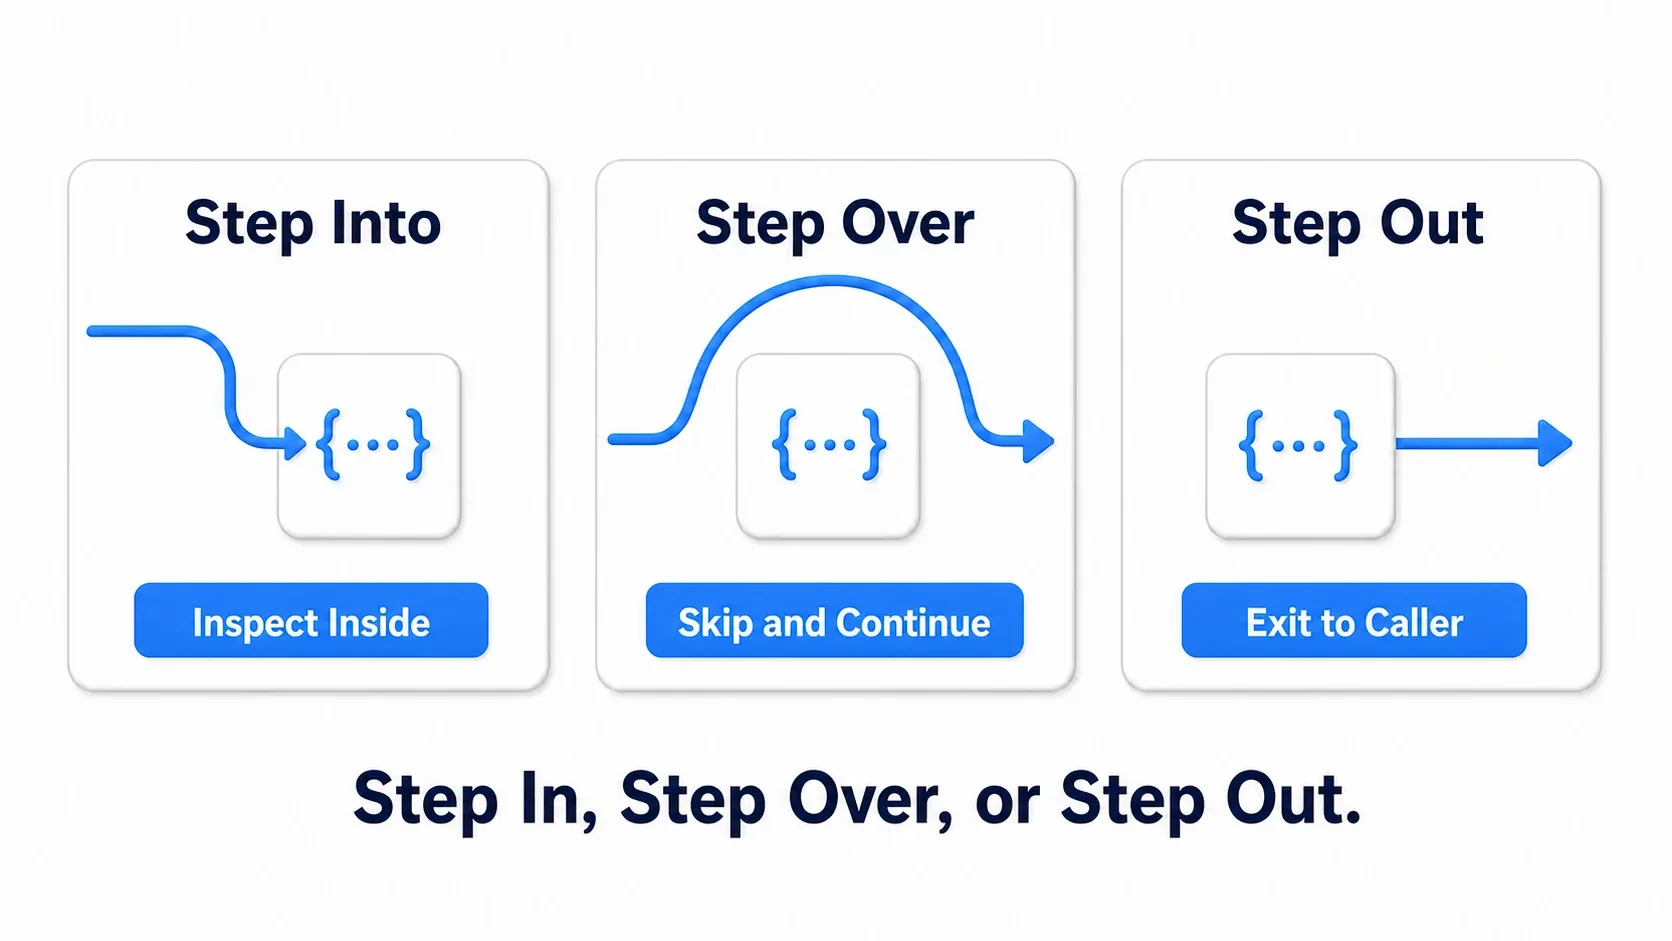
| Operation | What it does | When to use it |
|---|---|---|
Step Into (F11) | Advance to the next node, going inside functions and macros | When you suspect what's inside |
Step Over (F10) | Advance to the next node, taking only the result without entering the function | When you trust that function |
| Step Out | Run the current function to completion and return to where it was called from | When you went in and it turned out to be irrelevant |
| Resume | Run straight to the next breakpoint | When you're done observing |
Step Out and Resume are available from toolbar buttons (shortcut assignments vary by environment, so check and set them under keyboard shortcuts in Editor Preferences).
The trick is to only Step Into the suspicious functions and Step Over everything else. If you Step Into everything, you'll keep diving into shared functions and macros and get lost.
There's one more property worth knowing: the debugger can't rewind. When you think "I wanted to see the value of the node I just passed," add a breakpoint before it and repeat the same action from the start. That rhythm of "missed it, so re-place and re-run" is the basic motion of using a debugger.
Inspecting Values: Pin Hover and Watch
While paused, there are two ways to inspect values.
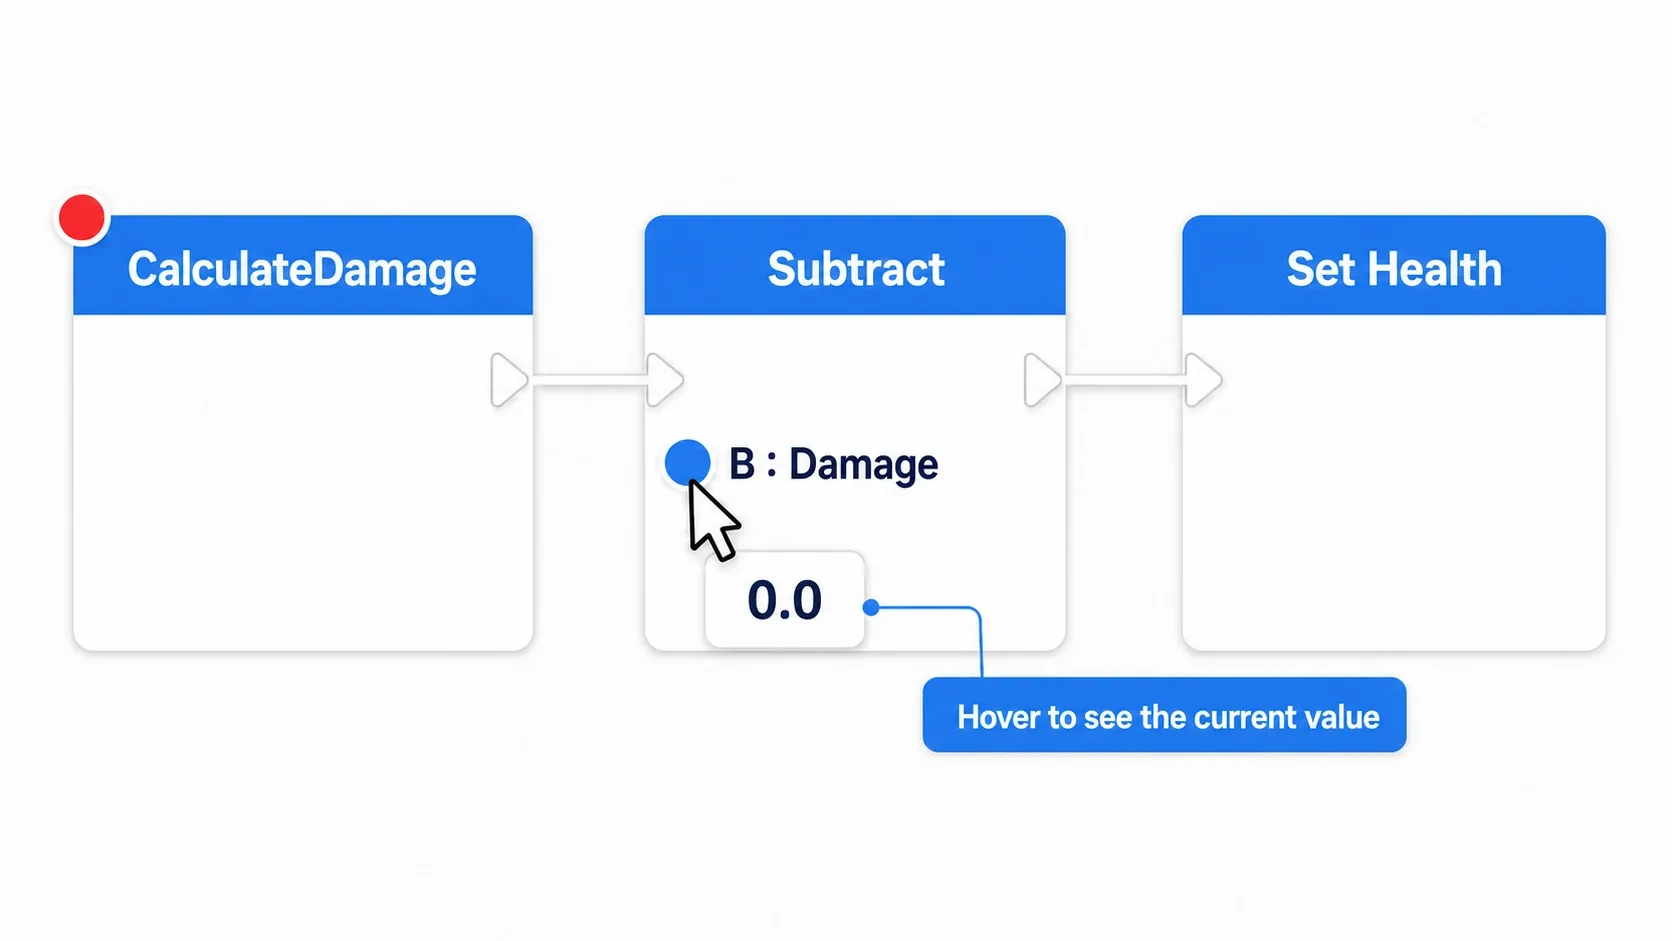
- Hover the mouse over a pin: The easiest and most-used option. Hover over a node's input or output pin and the value pops up, letting you check "what I passed in" and "what came back" at the same time. Note that what's shown is the value from the last time that node executed. Nodes that haven't run yet don't have this run's result on their output pins. If nothing shows up, step forward once and check again
- Add a watch: Right-click a variable or pin and choose "Watch Value," and it appears in the Blueprint Debugger window. Great when you're stopping repeatedly to check the same variable
Debug Object: Choosing Which Instance to Watch
The Blueprint editor toolbar has a Debug Object dropdown. If you don't know how it behaves, it will confuse you sooner or later.
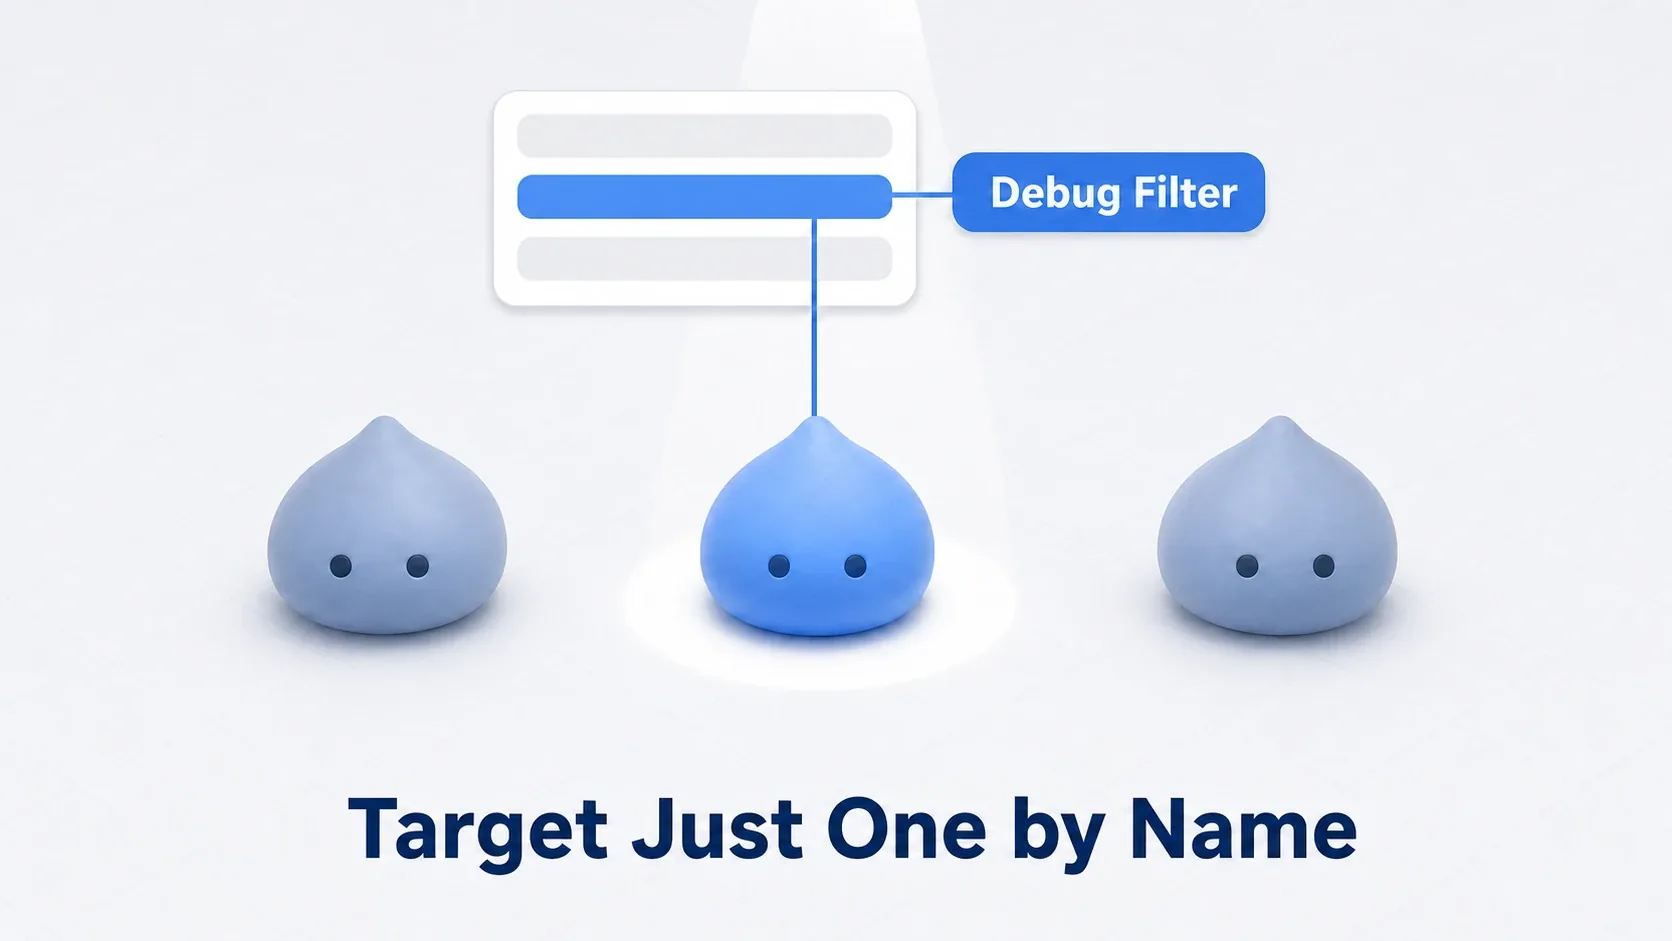
- Left unselected (default): Breakpoints trigger on any instance of that Blueprint. With ten enemies around, you stop on whichever one runs the logic first
- Naming one instance: Open the dropdown during PIE and you get a list of running instances. Pick one and only that instance becomes the observation target
The recommended order is "try it unselected first, and name an instance only if other instances start stopping and mixing you up." Trying to narrow it down from the start tends to cause avoidable stumbles, like "the list is empty so I can't choose" (there are no candidates before PIE starts) or "I picked one but I'm driving a different one, so it never stops."
Hands-On: Catching and Fixing the "Damage Is Zero" Bug
Now that we have the tools, let's catch one. The subject is the same "attacks land but HP doesn't drop" bug from the Print String article. Back then the three questions got us as far as "the value is wrong." This time we'll pinpoint exactly where the value breaks and fix it. Whether it's a melee slash in an action game or a bullet in a shooter, the structure is the same.
Setup to reproduce this (if you don't have a matching graph on hand, this is all you need to try it). In an enemy Blueprint called BP_Enemy, prepare these variables.
| Variable | Type | Default | Role |
|---|---|---|---|
Health | Float | 100.0 | The enemy's health |
BaseDamage | Float | 20.0 | Base damage per attack |
DamageMultiplier | Float | 0.0 | The multiplier. This 0 is the bug we planted on purpose |
Then wire up one function and one event like this. The graph looks like the following.
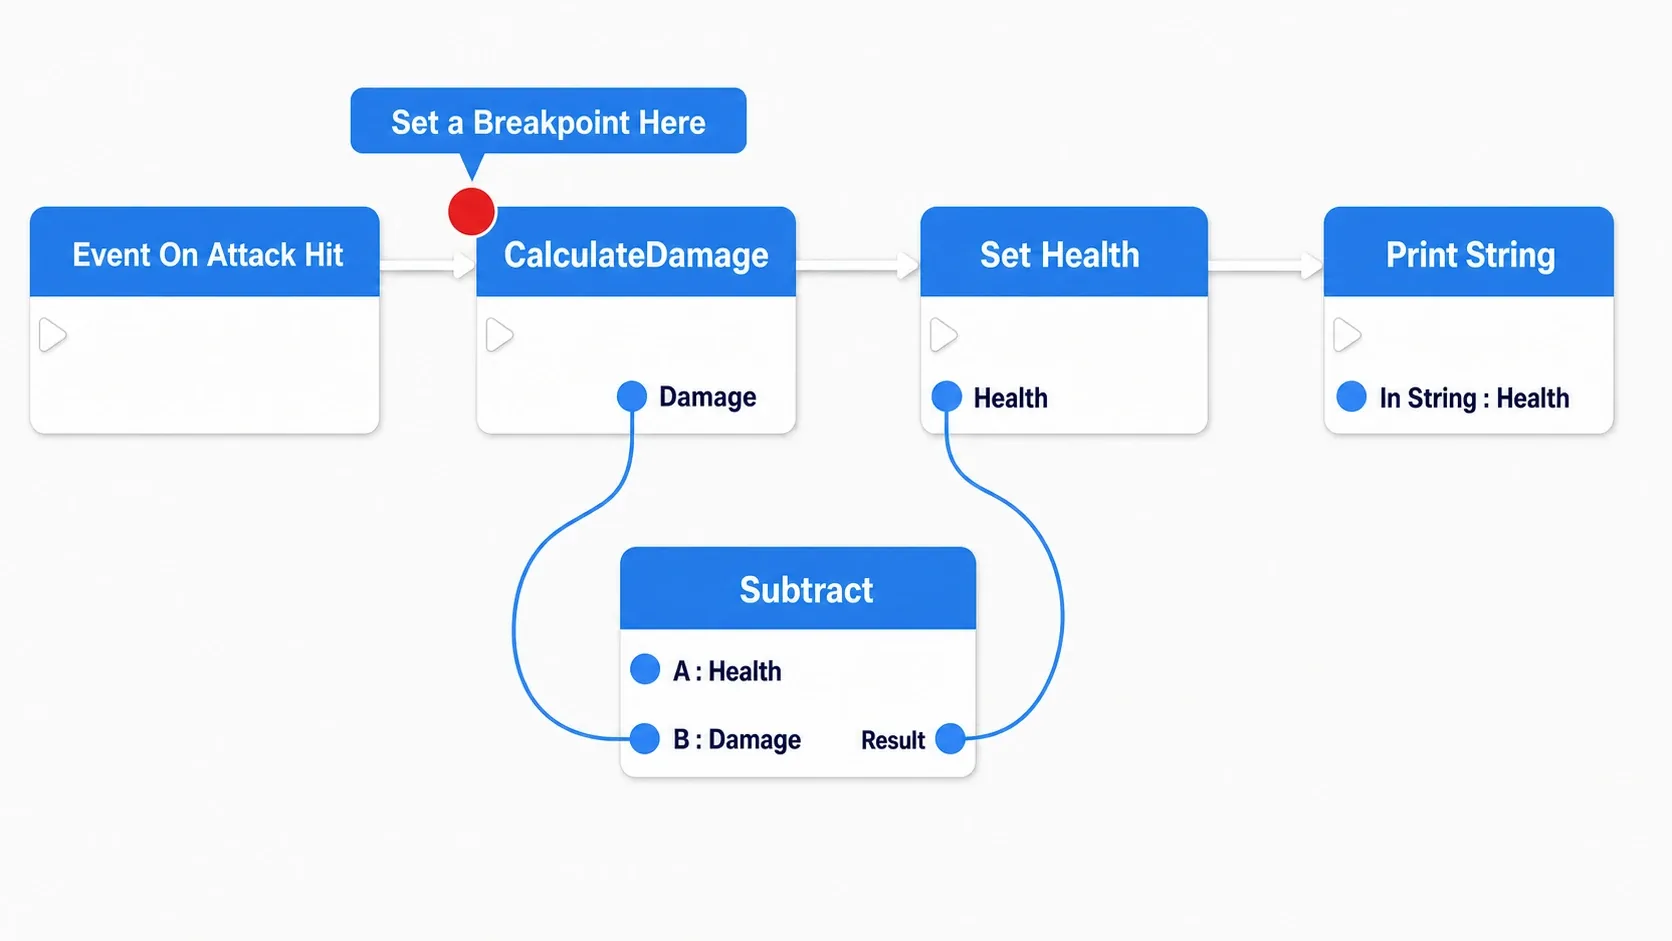
If you'd rather follow along in text, the same thing reads like this.
Function: CalculateDamage (return value: Damage / Float)
  → Multiply (A: BaseDamage, B: DamageMultiplier)
  → Return Node (Damage ← result of Multiply)

Event: when an attack lands (Event AnyDamage, Overlap, anything works)
  → call CalculateDamage                  ← ★ place the breakpoint here
  → Subtract (A: Health, B: return value of CalculateDamage)
  → Set Health (result of Subtract)
  → Print String (Append and display Health)
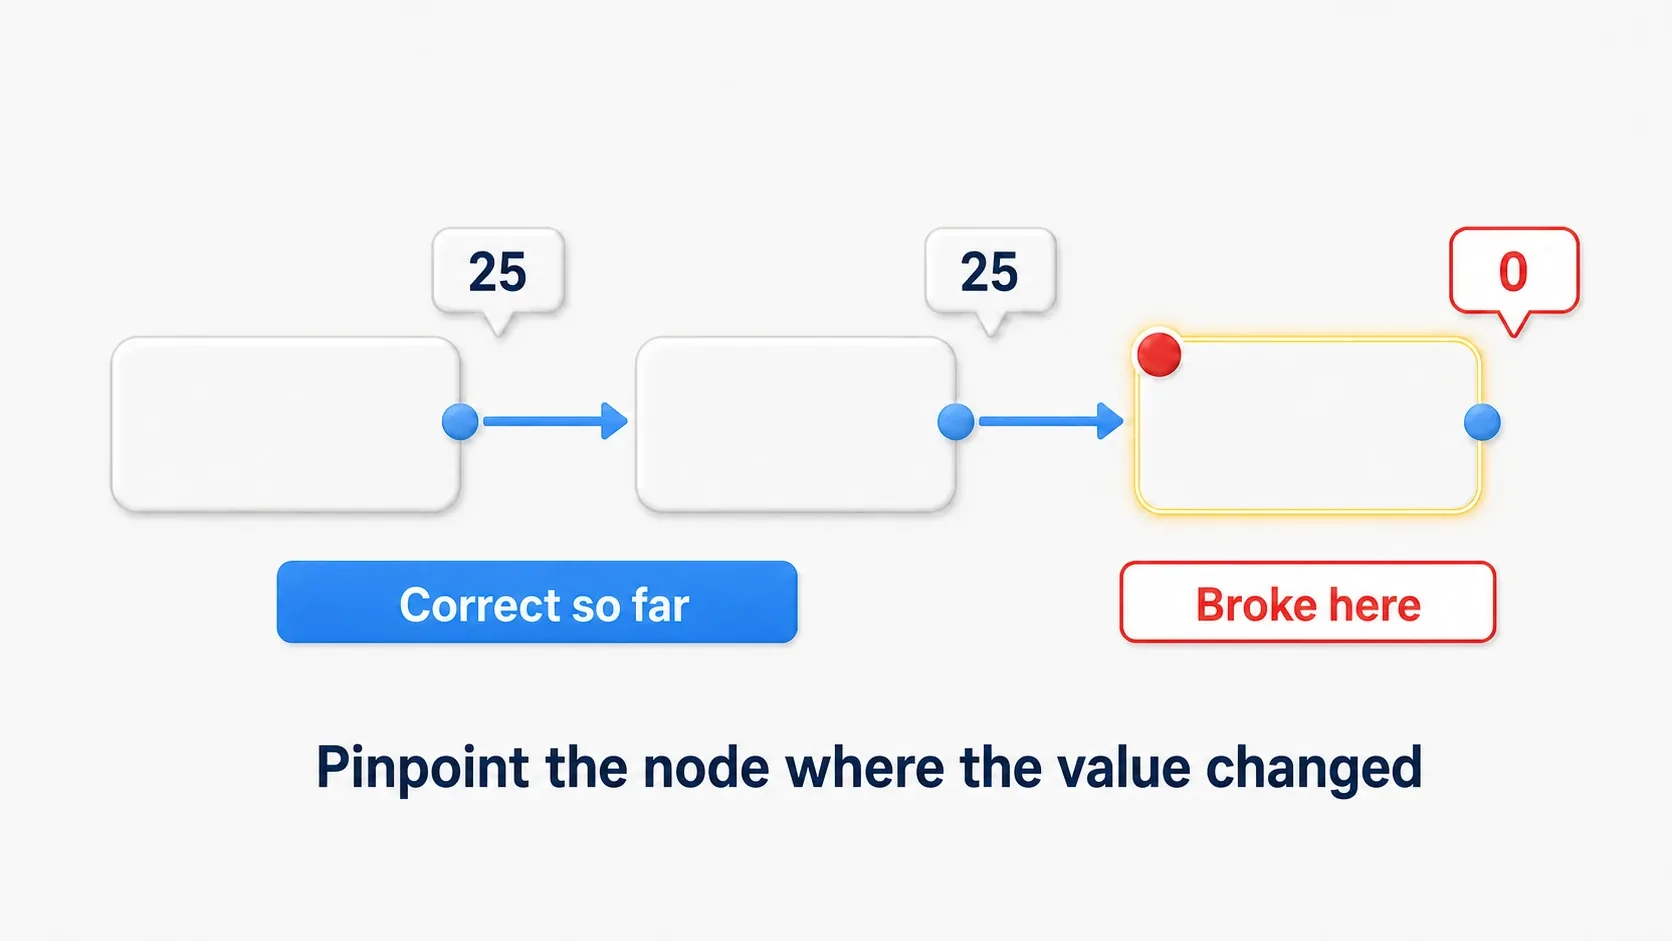
- Stop at the call site: Select the node that calls
CalculateDamageand pressF9. The key point is to place it at the call site, not inside the function - Attack and stop: Start PIE and land an attack, and execution stops at that node
- Go inside: Press
F11(Step Into) to enterCalculateDamage. You're now standing at the function's entrance, where you can check the values that came in - Follow the values: Press
F10to advance one step at a time and hover over the pins that have executed.BaseDamageis 20, which is correct. But the multiply result is 0. Hover over its partnerDamageMultiplierand that one is 0. There's your cause - Fix it and confirm: Stop PIE, change
DamageMultiplierto 1, and attack again. When HP drops from 100 to 80, you're done
With Print String this would have been several rounds of "insert a log in a suspicious spot and replay." Here it took one pass of stop, peek, fix.
Two things to take away.
- Put the breakpoint one step upstream of the symptom: Not on the Set node that reduces HP, but on the function call that produces its input. The cause is always upstream of the symptom
- If you miss it, re-place and re-run: The debugger can't rewind. When you think "I want to see one step earlier," add a breakpoint and repeat the same action
Bonus: Good to Know for Later
After a fix, add one test that prevents the regression. The moment you've tracked down a cause and fixed it is the best time to write a test that reproduces that bug. Encode the same conditions once and you'll never step in the same hole twice (→ Automated Testing in UE).
- If the game grabs your mouse during PIE, press
Shift + F1: When the game holds the mouse, you can't operate editor dropdowns or actors.Shift + F1returns the cursor to the editor - You can break automatically on Accessed None: There's a feature that stops the debugger when you touch an empty reference. Enable Blueprint Break on Exceptions under
Editor Preferences → Experimental → Blueprintsand you jump straight to where the error occurs (it's flagged as experimental, so leaving it on permanently is up to you) - Clean up your breakpoints: Delete or disable them once you're done. Leftover breakpoints stop the game out of nowhere during completely unrelated work days later. The list in the Blueprint Debugger window lets you review them all at once
- Breaking inside a Component: You can set breakpoints on events in custom Components too. In that case the Debug Object is an instance of that Component, and you pick it using the owning actor's name as a clue (see the Blueprint Component article)
Summary
- Print String is the tool for following the trail; Blueprint Debugger is the tool for stopping on the spot. Use logs until you've narrowed the location, then the debugger. But bugs that vanish when you pause belong to logs
- Set with F9, advance with F11 (Into) / F10 (Over). Only Step Into the suspicious functions
- Hovering pins is the fastest way to see values. If nothing appears, that node hasn't executed yet
- Debug Object stops on every instance when unselected. Name one only when the mixing becomes a problem
- The debugger can't rewind, so if you miss something, re-place the breakpoint and re-run
If your graph is so complex you can't even decide where to put a breakpoint, the shortcut is to improve visibility first with 10 techniques for organizing Blueprint graphs. If you want to know which mines are easiest to step on in the first place, head to 10 common Blueprint mistakes.
That logic you're convinced "just doesn't work for some reason": next time you open it, why not press F9 on the node that calls it before adding one more log?