You kept adding assets to a level and at some point it started stuttering. So you weaken the post process, drop the texture resolution, fiddle with the shadow settings. Still no change.
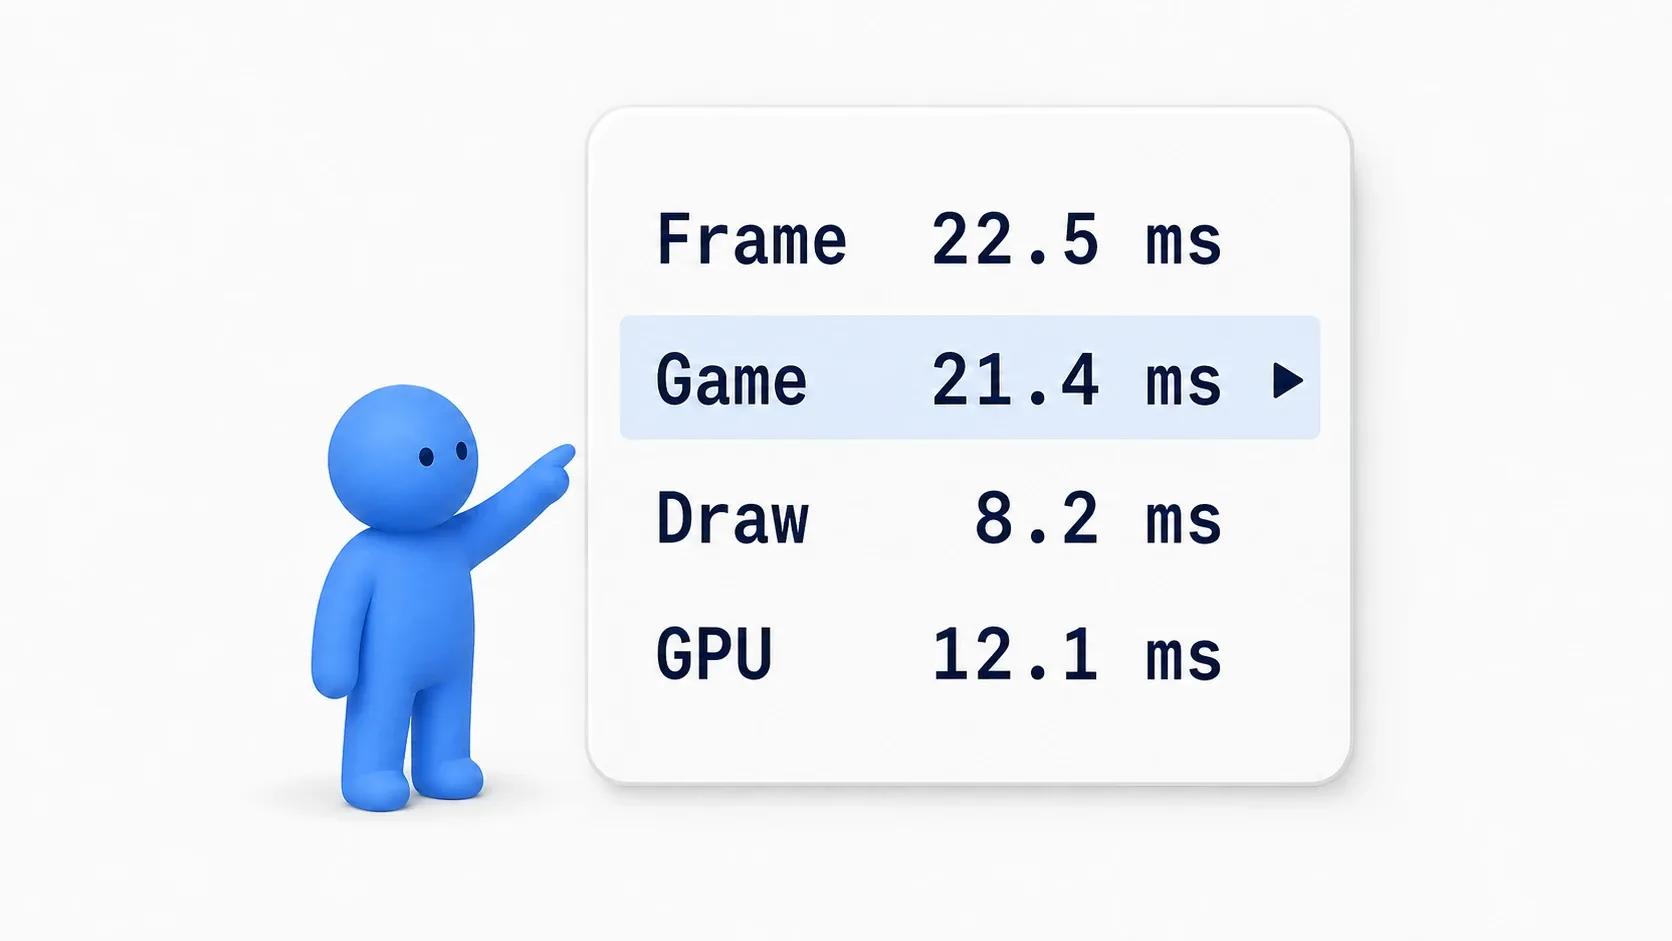
What is happening here is treating a problem without knowing its cause. UE5 has a command that tells you within seconds whether the slowdown lives in CPU game logic, CPU rendering work, or the GPU. This article covers how to read the four numbers stat unit shows and how to narrow down the cause from there.
What You'll Learn
- Why judging by feel leads you to fix the wrong place
- What Frame / Game / Draw / GPU in
stat unitactually measure- A table for judging the bottleneck from those four numbers
- Drilling down with
stat game/stat scenerendering/ the GPU Visualizer- Hands-on: open a heavy level and go from measuring to catching the culprit to fixing it
Why "Measure First"
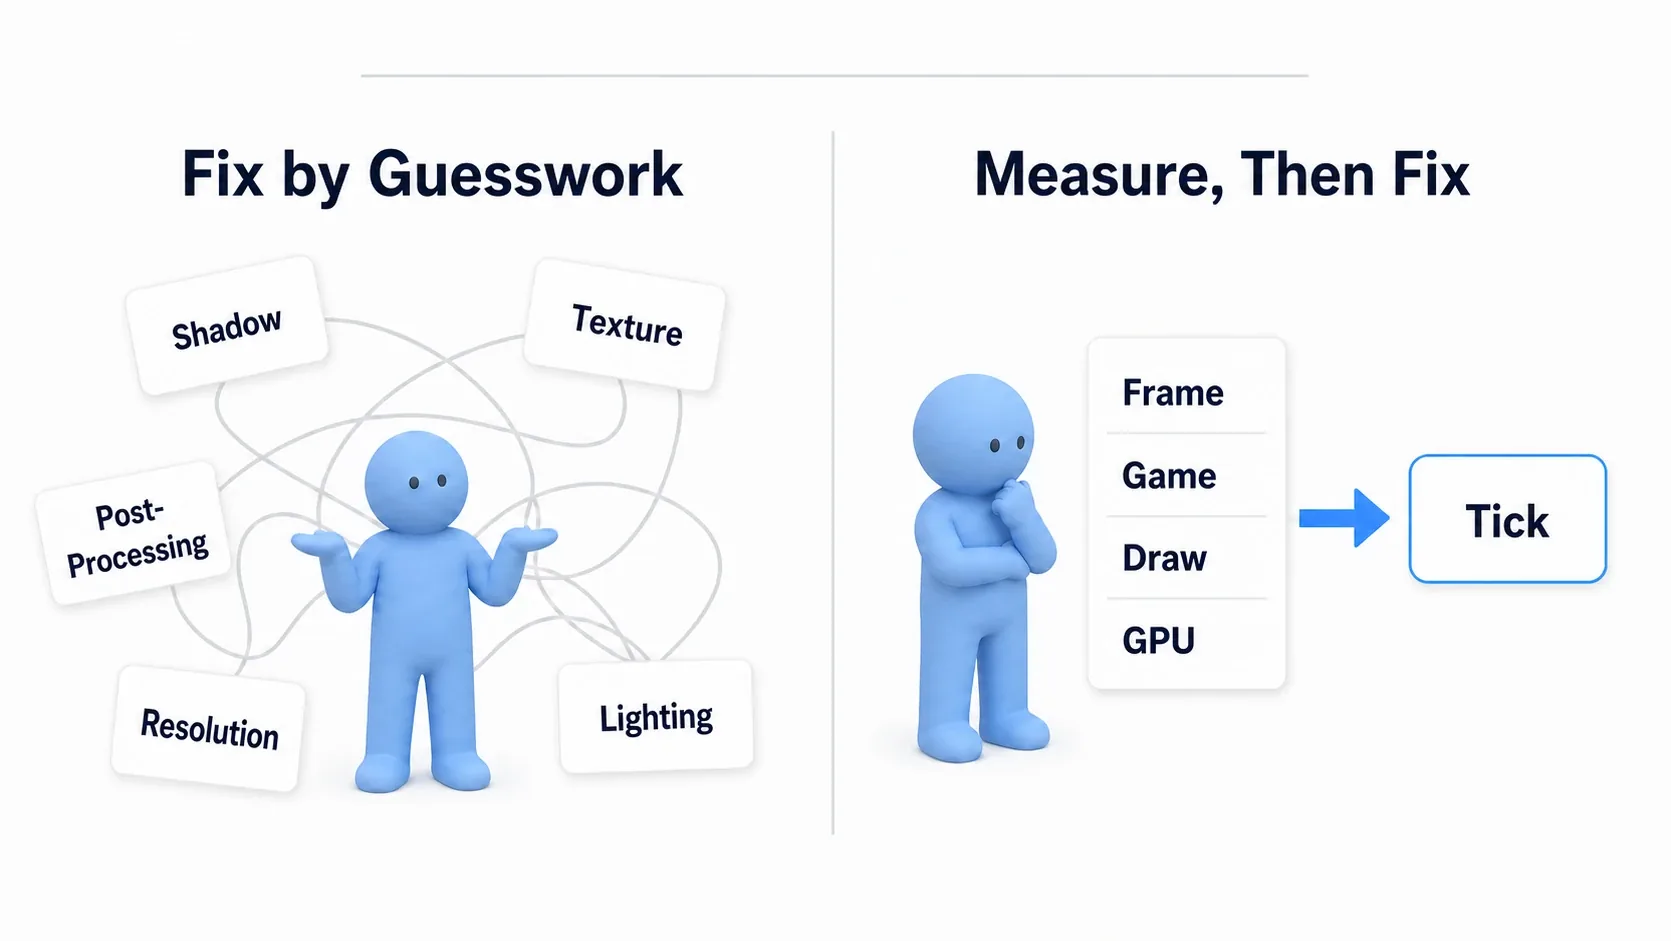
Performance problems have an awkward property: the symptom is always the same stutter, but the cause is in a completely different place each time.
If lightening your textures does not change the frame rate, textures were never the bottleneck. Keep changing settings in that state and you end up with worse image quality at the same speed.
There is one more mental switch to make up front: units. In performance work you think in frame time (the milliseconds one frame took) rather than FPS (frames per second).
| Target FPS | Time allowed per frame |
|---|---|
| 30 FPS | 33.3 ms |
| 60 FPS | 16.6 ms |
| 120 FPS | 8.3 ms |
FPS invites misreadings. Dropping from 120 FPS to 60 FPS and dropping from 40 FPS to 30 FPS are both an 8.3 millisecond regression, meaning the same amount of added load. "The FPS halved" and "the FPS only dropped by 10" feel very different but are not. In milliseconds you can see they are events of the same size.
That is why the profiling commands display milliseconds rather than FPS: so you see a unit you can add and subtract.
stat unit: What the Four Numbers Mean
While playing, open the console (the ` key by default) and type stat unit. A set of numbers appears in the upper right of the screen.
If the console will not open: on Japanese keyboards it can conflict with the half-width/full-width key. Add a key under
Console KeysinProject Settings → Engine → Input → Console.
| Item | What it measures | Who is doing the work |
|---|---|---|
| Frame | The total time one frame took | The overall result |
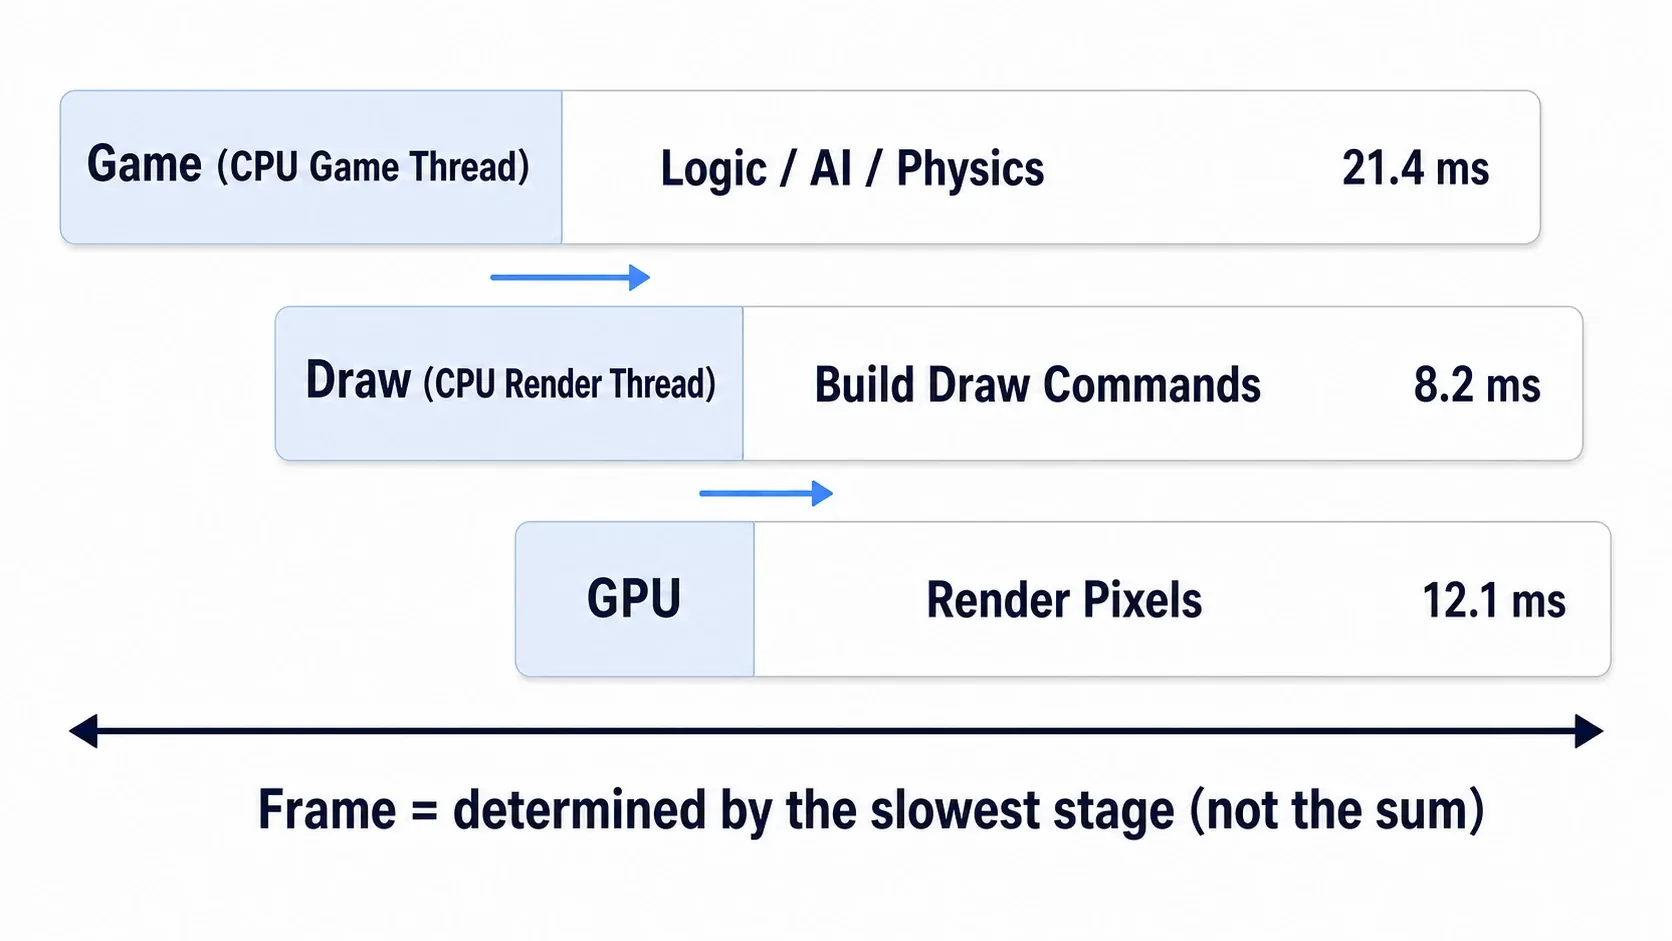
| Game | Game logic such as Blueprint, C++, AI, and physics | CPU (game thread) |
| Draw | The work of telling the GPU "draw this" | CPU (render thread) |
| GPU | Actually filling in pixels | GPU |
The one that gets misread most is Draw. Draw is not "time spent drawing," it is the time the CPU spends assembling and handing over draw commands. When Draw grows after you place 1,000 objects, it is not because the GPU is tired; it is because the CPU is writing 1,000 sets of instructions.
And these three run at the same time. UE pipelines the game thread, the render thread, and the GPU, so while the GPU paints the current frame, the game thread is computing the next one.
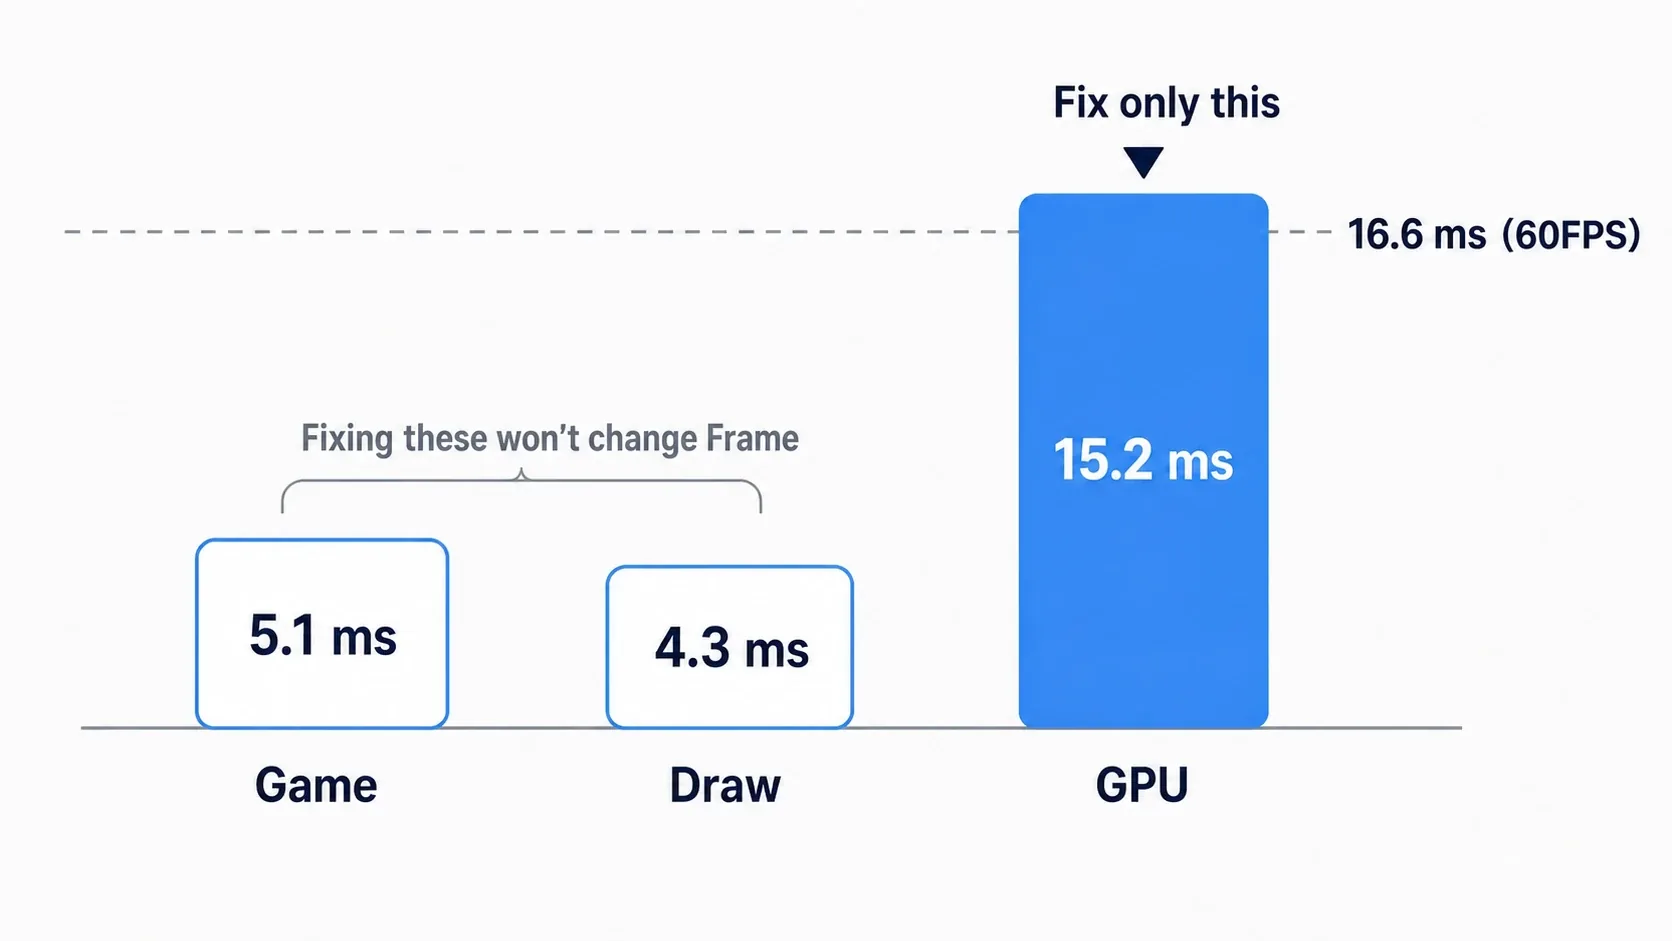
That means Frame is not the sum of the three. It is dragged down by whichever of them is slowest. With Game 5 ms / Draw 4 ms / GPU 15 ms, Frame is a bit over 15 ms rather than 24 ms. The speed of a line of workers is set by the slowest one.
This property is what determines your optimization strategy. Shaving anything other than the largest number will not move Frame.
Judging Which One Is the Bottleneck
Once you have the four numbers, read them in this order.
- Look at Frame and check whether it exceeds your target (16.6 ms for 60 FPS)
- If it does, find whichever of Game, Draw, and GPU is closest to Frame
- Make that one, and only that one, your optimization target
| If the largest is | What to suspect | Common causes |
|---|---|---|
| Game | Game logic | Overuse of Event Tick, per-frame Get All Actors Of Class, heavy AI, too many characters |
| Draw | The number of draw commands | Too many objects, too many material slots, no instancing, too many shadow casters |
| GPU | The cost of filling pixels | Complex shaders, overlapping translucency (overdraw), post processing, high resolution |
There are two things to watch out for when judging.
If the GPU number is pinned, suspect vsync. If every number is unnaturally stable around 16.6 ms, that is not a limit you hit, it is a frame rate cap. Remove the cap with t.MaxFPS 0, turn off the smoothing settings under Editor Preferences → Performance, and measure again.
When Game and Draw are close together, suspect Game first. When the game thread falls behind, the render thread waits, and that wait time can show up inside the Draw number. "I lightened Game and Draw came down with it" is a common story.
Digging One Level Deeper: The Next Move for Game, Draw, and GPU
Once you know who is responsible, find out what inside them is heavy. stat unit only tells you "who." For "what," use the following commands.
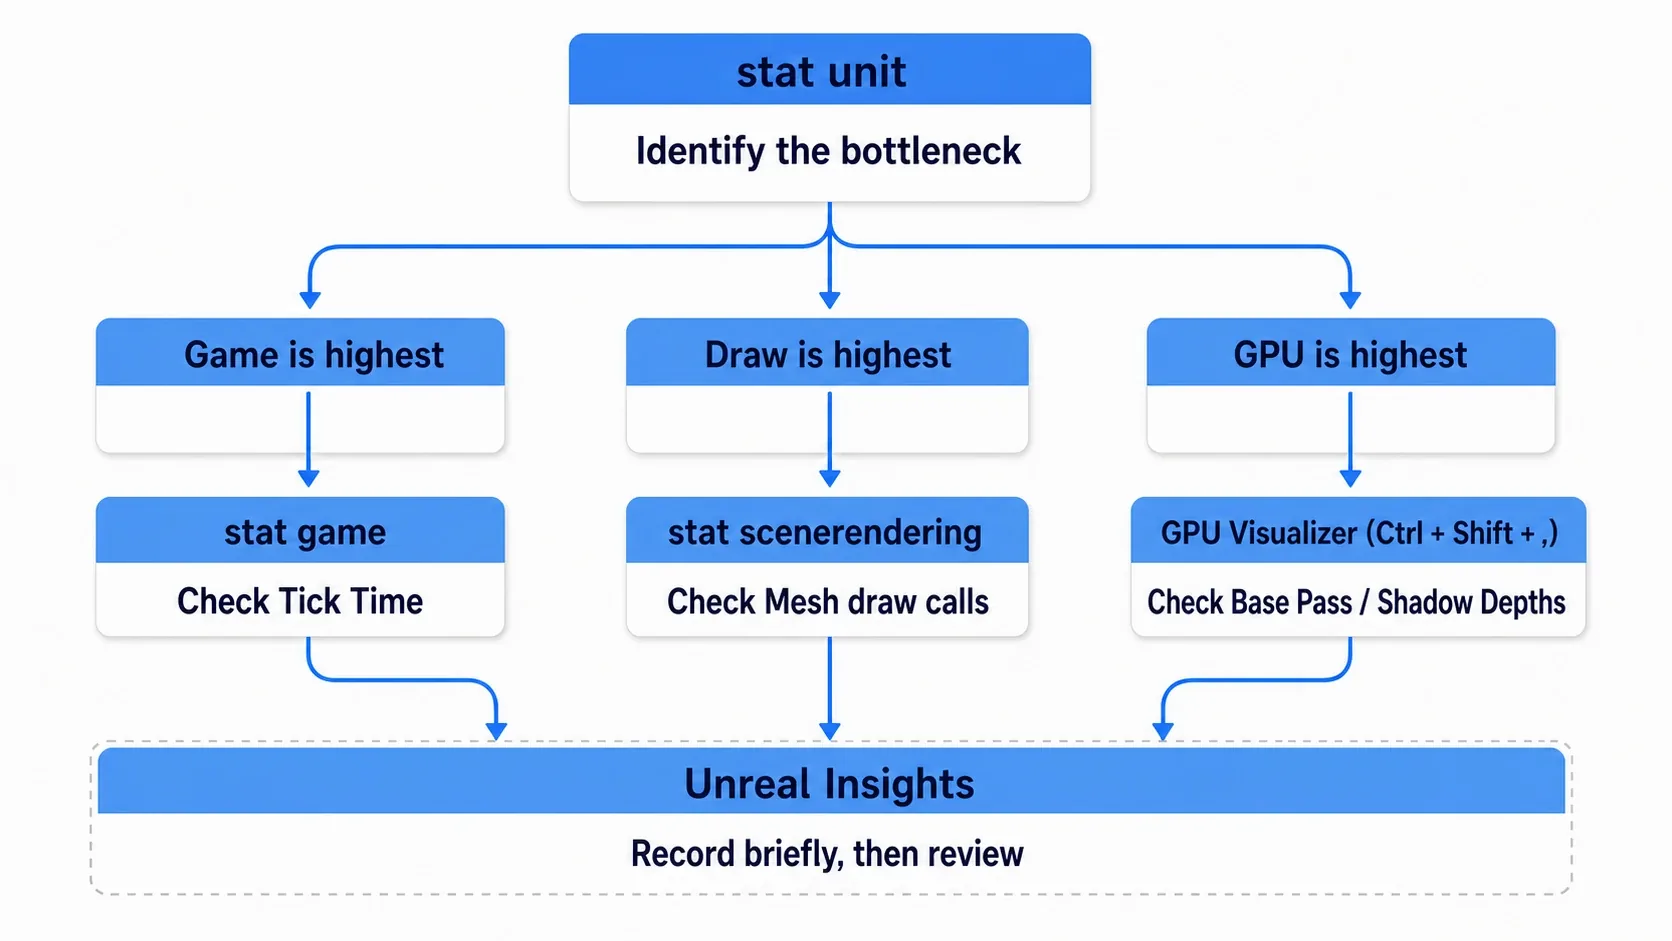
| Bottleneck | What to run next | What it shows |
|---|---|---|
| Game | stat game | Time per processing category such as Tick, AI, and physics |
| Draw | stat scenerendering | Draw call counts, visible primitive counts, culling time |
| Draw | stat initviews | How many objects frustum culling and occlusion excluded |
| GPU | GPU Visualizer (Ctrl + Shift + ,) | Time per render pass (Base Pass / Shadow Depths / Lighting / Post Processing) |
| Load hitches | stat streaming | Texture and mesh streaming status |
In stat game, the first thing to look at is Tick Time. A large value there means too many actors are running every frame. Concrete ways to reduce Tick are collected in Tick-free Blueprint design.
In stat scenerendering, look at the Mesh draw calls count. If it is in the thousands, you are at the stage of reducing what you draw at all.
The GPU Visualizer opens with Ctrl + Shift + , (Ctrl + Shift + comma) during play. Typing profilegpu in the console does the same thing. It gives you a breakdown of one frame of GPU work, so work through the passes from the largest time down. If Shadow Depths stands out, you have too many objects casting dynamic shadows.
Unreal Insights is the tool beyond this. Where stat shows you the numbers at this instant, Insights records tens of seconds at once so you can review it later on a timeline. Use it for problems you cannot catch by eye, like "an unexplained spike once every 30 seconds." You start recording from the trace icon on the right side of the editor toolbar. stat unit is enough for now, so this is just an introduction to the entrance. If the spike is a load hitch, the kind where the game freezes the moment a new enemy or area appears, spreading the loading out with soft references and async loading is what helps.
Hands-On: Tracking Down the Culprit in a Heavy Level
Lining up trees in an open-world forest, passing 100 enemies in a tower defense, filling a horror game with props. "It got heavy the moment I built it out" happens in every genre. Here we deliberately build a heavy level and go all the way from catching the culprit to fixing it.
Building the Setup
Open ThirdPersonMap from the Third Person template and add these two things.
| What to add | Details | Count |
|---|---|---|
| Tree Static Mesh | Roughly 8,000 triangles (Starter Content's SM_Rock works too) | 2,000 |
BP_Spinner | A new Actor. Add one Static Mesh Component and Event Tick → Add Actor Local Rotation (Yaw of Delta Rotation set to Delta Seconds × 90) | 800 |
You do not have to place them by hand. Place one and Alt + drag to duplicate, or loop Spawn Actor from Class from the level Blueprint's BeginPlay.
Step 1: Measure in Standalone
From the dropdown next to Play in the toolbar, choose Standalone Game and launch. PIE mixes in the editor's own rendering, so we avoid it here.
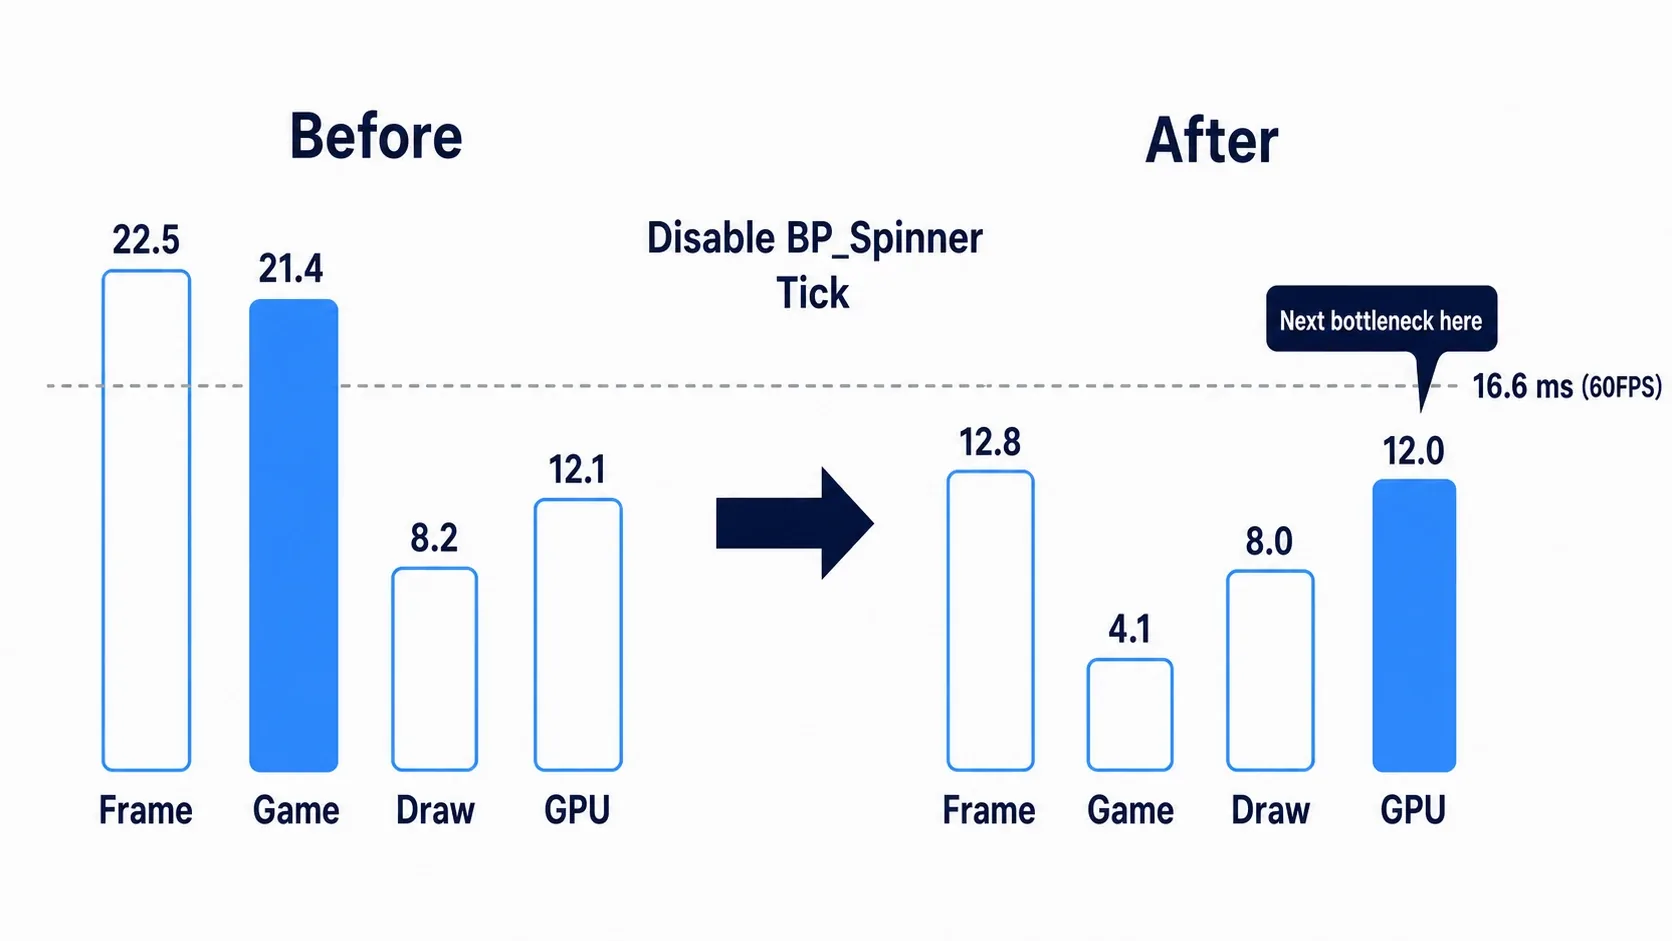
Open the console with the ` key and run stat unit. You get numbers like these.
Frame:  22.51 ms
Game:   21.42 ms
Draw:    8.23 ms
GPU:    12.09 ms
Frame 22.51 ms is equivalent to 44 FPS, short of the 60 FPS target (16.6 ms).
The number closest to Frame is Game at 21.42 ms. The culprit is on the game logic side, not the tree rendering (Draw / GPU). Fiddling with textures or shadow settings here would have been wasted time.
Step 2: Break Game Down
Next, run stat game. Look at Tick Time in the list.
Most of Game's 21.42 ms should be going into Tick, which makes sense: 800 BP_Spinner actors are running rotation logic every frame.
Step 3: Fix It and Measure Again
Open BP_Spinner and uncheck Actor Tick → Start with Tick Enabled in Class Defaults. The rotation stops, but the goal here is isolating the load.
Launch Standalone Game again and run stat unit.
Frame:  12.84 ms
Game:    4.11 ms
Draw:    8.02 ms
GPU:    12.01 ms
Game dropped from 21.42 ms to 4.11 ms, and Frame went from 22.51 ms to 12.84 ms, under the 16.6 ms target.
Notice that the ordering of the numbers changed too. The largest is now GPU at 12.01 ms. Catch one culprit and the next one steps forward. If you want to push further, the GPU side is your next target.
Here is how to narrow it down when things do not go as expected.
- The numbers will not move off around 16.6 ms → you are hitting vsync or a frame cap. Run
t.MaxFPS 0and measure again - Game does not come down → something other than
BP_Spinneris ticking. CheckTick Timeinstat gameonce more - The numbers differ a lot from PIE → that is normal. PIE includes the editor's rendering, so it measures heavier than Standalone
Two things to take away.
- Only ever deal with the largest number: at Game 21 ms / Draw 8 ms, halving Draw will not move Frame by a single millisecond. Pick the largest of the three, fix it until it is no longer the largest, and repeat. That loop is the basic form of optimization
- Always re-measure after a fix: because the culprit changes. In the example above, GPU became the largest the moment Game was fixed. Run measure → fix → measure again as a set
If Game turned out to be heavy, go to Tick-free Blueprint design. If the cause is spawning projectiles or effects every frame, object pooling reuses them instead. If Draw is heavy, the next article, LOD, culling, and occlusion, reduces the amount you draw in the first place.
Bonus: Good to Know for Later
When you need to reach the function, use Unreal Insights. stat tells you which thread is backed up and stops there. To pin down which Actor and which function cost how many milliseconds, the next step is recording a trace and reading it afterward with Unreal Insights.
Use stat unitgraph to see variation. The stat unit numbers change constantly, which makes momentary spikes hard to read. Running stat unitgraph shows the same four items as line graphs. Problems like "it spikes only when a particular enemy spawns" are much easier to spot on a graph.
The same command turns the display off. The stat commands are toggles. Type stat unit again and it disappears. stat none clears every display at once.
Measure from the same position and angle. Change the camera direction and what is visible changes, which changes Draw and GPU. When comparing before and after an optimization, always measure from the same position facing the same way. Otherwise you cannot tell whether the difference is your fix or just a different view.
Do not measure while shaders are compiling in the editor. While the compile progress is showing in the lower right, the CPU is busy with it and the numbers jump. Wait until it settles.
You may see a line called RHIT. That is the RHI thread (the dedicated thread that pushes draw commands to the graphics API). Usually you can ignore it, but if Draw is low while only this is high, you can conclude that is where the traffic jam is.
Summary
| Stage | What to do |
|---|---|
| 1. Get the big picture | Run stat unit and look at Frame, Game, Draw, and GPU |
| 2. Identify the culprit | Pick the one of Game, Draw, and GPU closest to Frame |
| 3. Drill down | stat game for Game, stat scenerendering for Draw, the GPU Visualizer for GPU |
| 4. Fix | Fix only that one place |
| 5. Re-measure | Run stat unit again and check whether the culprit has changed |
Three things are worth holding onto. Frame is not the sum of the three; it is dragged down by the slowest one. Draw is not time spent drawing, it is time the CPU spends issuing draw commands. And shaving anything but the largest number will not move Frame.
Once those three sink in, you are out of guesswork optimization like "let's just turn off shadows."
The next article covers what to do when Draw is the culprit, in LOD, culling, and occlusion. After that comes level streaming and World Partition, which reduces how much gets loaded in the first place.
Launch your own project once in Standalone Game and run stat unit. Which was the largest number: Game, Draw, or GPU?