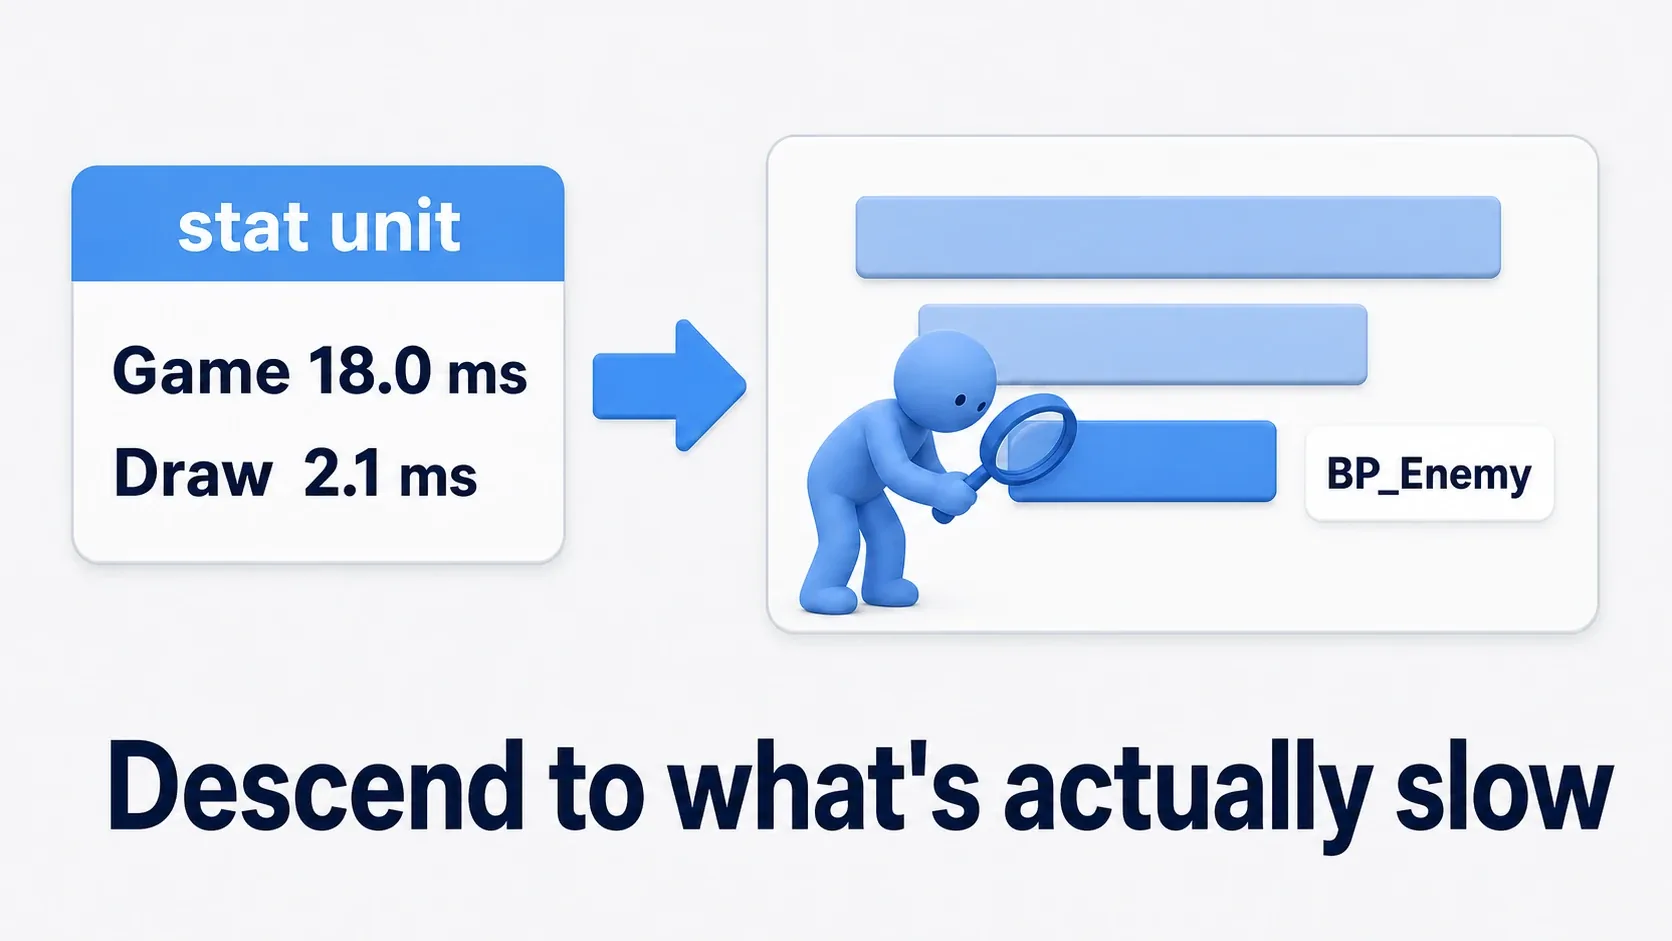
You brought up stat unit and Game reads 18 ms. So the CPU is the problem. And then you're stuck — because you still don't know which Actor, or which piece of logic, is responsible.
stat tells you where things are backed up, and that's where its job ends. Unreal Insights records an entire run so you can open a single frame afterward and read its contents function by function. This article covers recording a trace, reading Timing Insights, and drilling down the call hierarchy until you land on your own Blueprint.
What You'll Learn
- How
statand Insights divide the work- Recording a trace (from the editor, or via launch arguments)
- 🚨 Surfacing your Blueprint names needs
-statnamedevents- Opening a single frame in Timing Insights
- Drilling the call hierarchy until your Blueprint appears
- Memory Insights for what's eating memory
- Hands-on: narrow down with stat, confirm with Insights
What stat Tells You, and What It Doesn't
The stat commands are for leaving a readout on screen and knowing the current state. stat unit gives you Frame / Game / Draw / GPU, which tells you where the backup is.
What it can't tell you is what comes next.
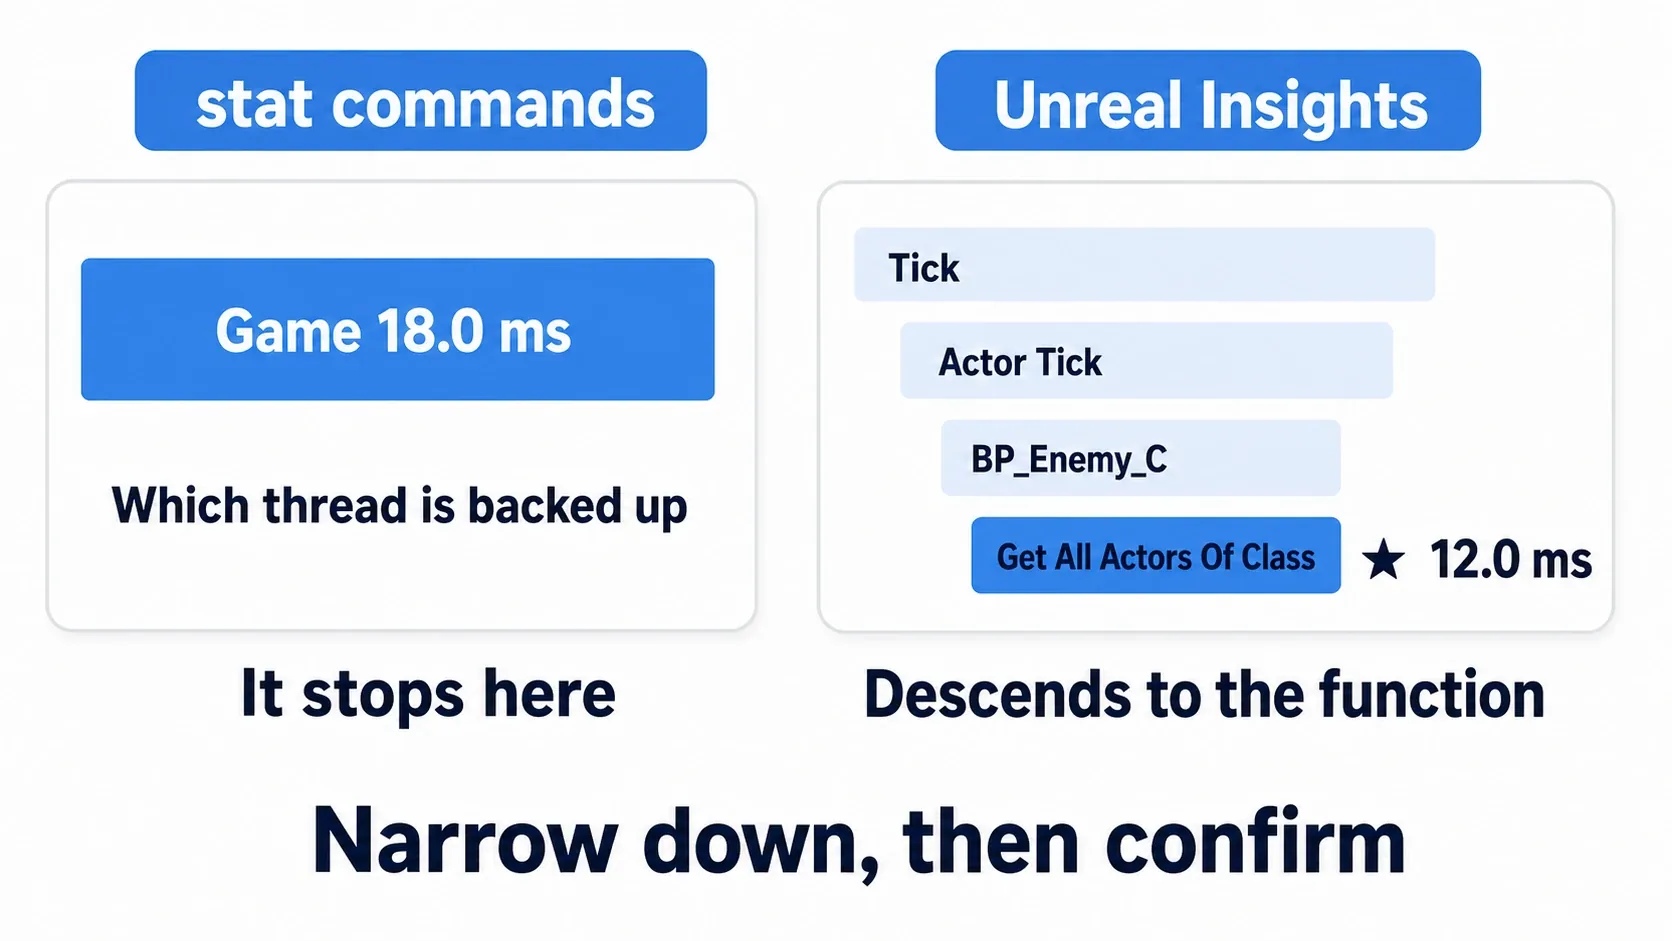
| stat commands | Unreal Insights | |
|---|---|---|
| What you see | Which thread is backed up | Which function took how long |
| Granularity | Per thread, per system | Per individual call |
| When you look | Live, while running | Recorded, opened afterward |
| Good at | Narrowing down | Confirming |
So the two don't compete. The order is narrow down with stat, confirm with Insights.
If stat unit's Game is large, CPU-side game logic is heavy. Open Insights and those 18 ms break out into a bar per function.
Recording a Trace
Unreal Insights splits the recording tool from the viewing tool. You record while the game runs, then open the resulting file (.utrace) afterward.
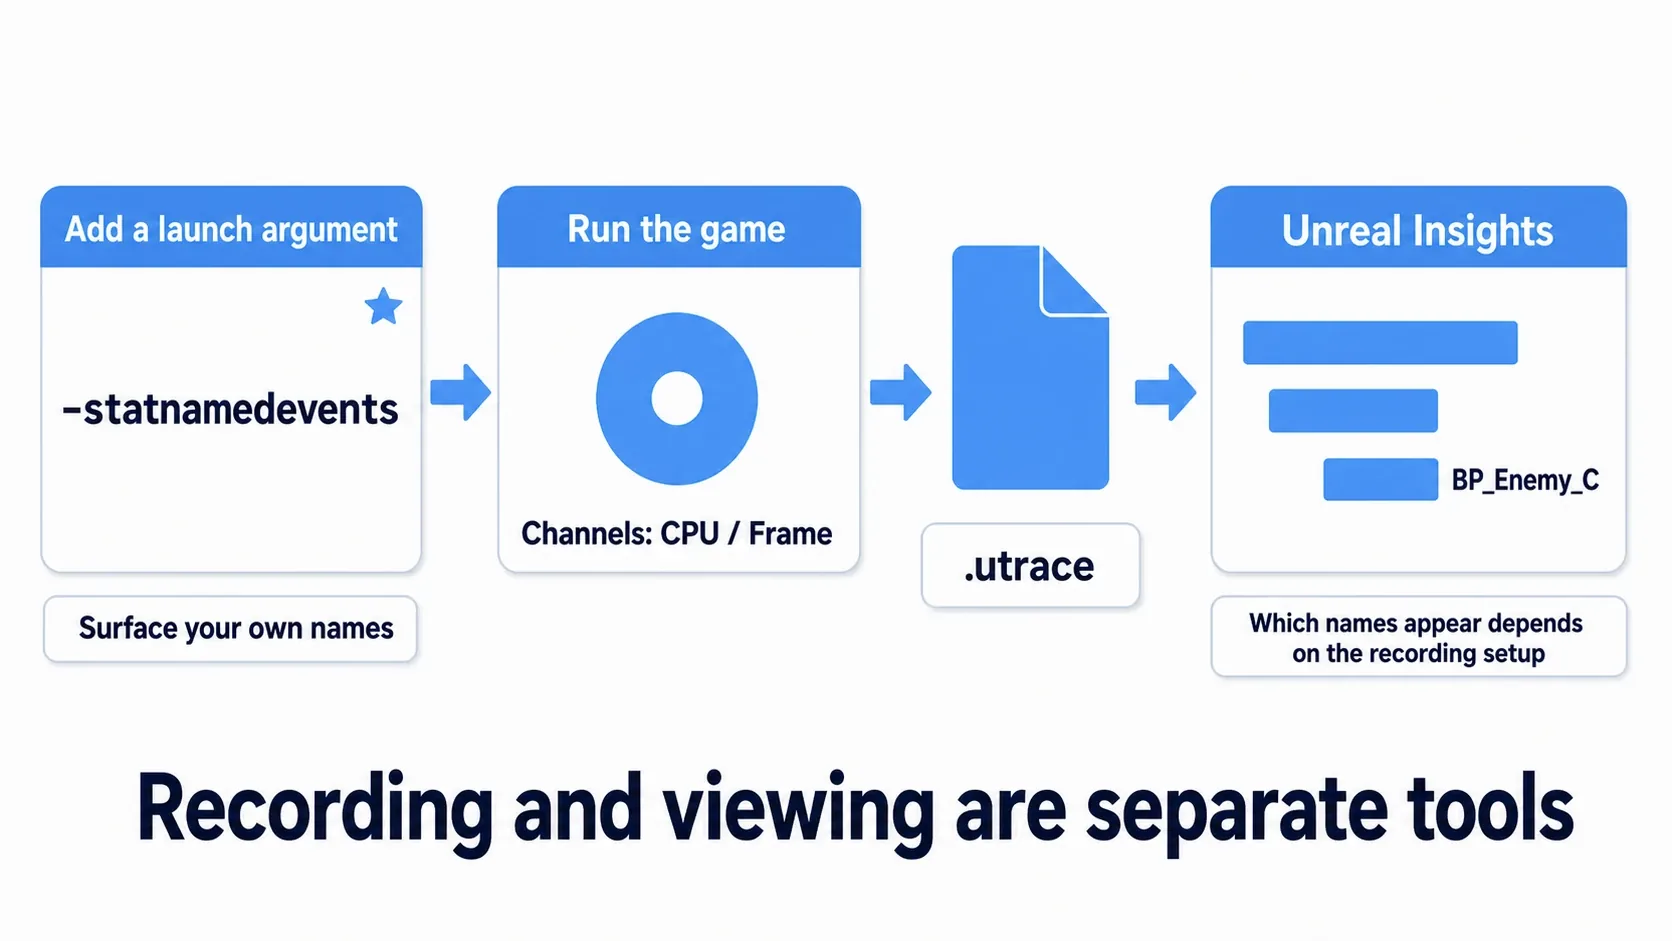
The easiest route is the trace button in the editor's status bar, bottom right. Press it to start recording, press again to stop. Stopping writes out a .utrace file.
What you choose when recording are the channels — what gets captured. Recording everything is heavy, so narrow it to your purpose.
| Channel | What it records | When |
|---|---|---|
| CPU | Function calls and their durations | Start here. Anything CPU-heavy |
| GPU | Rendering durations | When stat unit's GPU is large |
| Frame | Frame boundaries | Always (it's the ruler on the timeline) |
| Memory | Allocations and frees | Memory investigations (below) |
CPU and Frame alone are enough to start. Turning on every channel makes the recording itself heavy, burying the load you came to measure.
Open the .utrace in the Unreal Insights app — a standalone application in the engine install. When you record from the editor, there's often a way to open it right from the same button.
Step away from the editor to measure. When precision matters, measure in Standalone Game or a packaged Development build rather than editor Play. Editor Play mixes in the editor's own rendering and tooling.
Get Your Own Names to Show Up
There's one thing to settle first. By default, the Blueprints you made may not appear by name at all.
A standard trace is dominated by engine-internal names. To surface something like BP_Enemy_C, you need to record with named events enabled.
Adding -statnamedevents to the launch arguments is the most reliable route.
MyGame.exe -statnamedevents
And crucially: before you start the real investigation, confirm that names appear at all.
- Launch with
-statnamedevents - Record for five seconds
- Open it in Insights and look for anything starting with
BP_ - If there's nothing, revisit the launch arguments and channel settings
Skip this and you can't tell "there's no heavy work" from "the names just aren't showing." It takes thirty seconds, so always do it first.
How fine the detail gets depends on your setup.
BP_Enemy_Cmay appear whileGet All Actors Of Classinside it does not — that comes down to recording settings. Reaching the Blueprint name is enough. To narrow further, open that Blueprint and read the nodes, or add your own named events.
Reading Timing Insights
Once the .utrace is open, the tab you'll live in is Timing Insights.
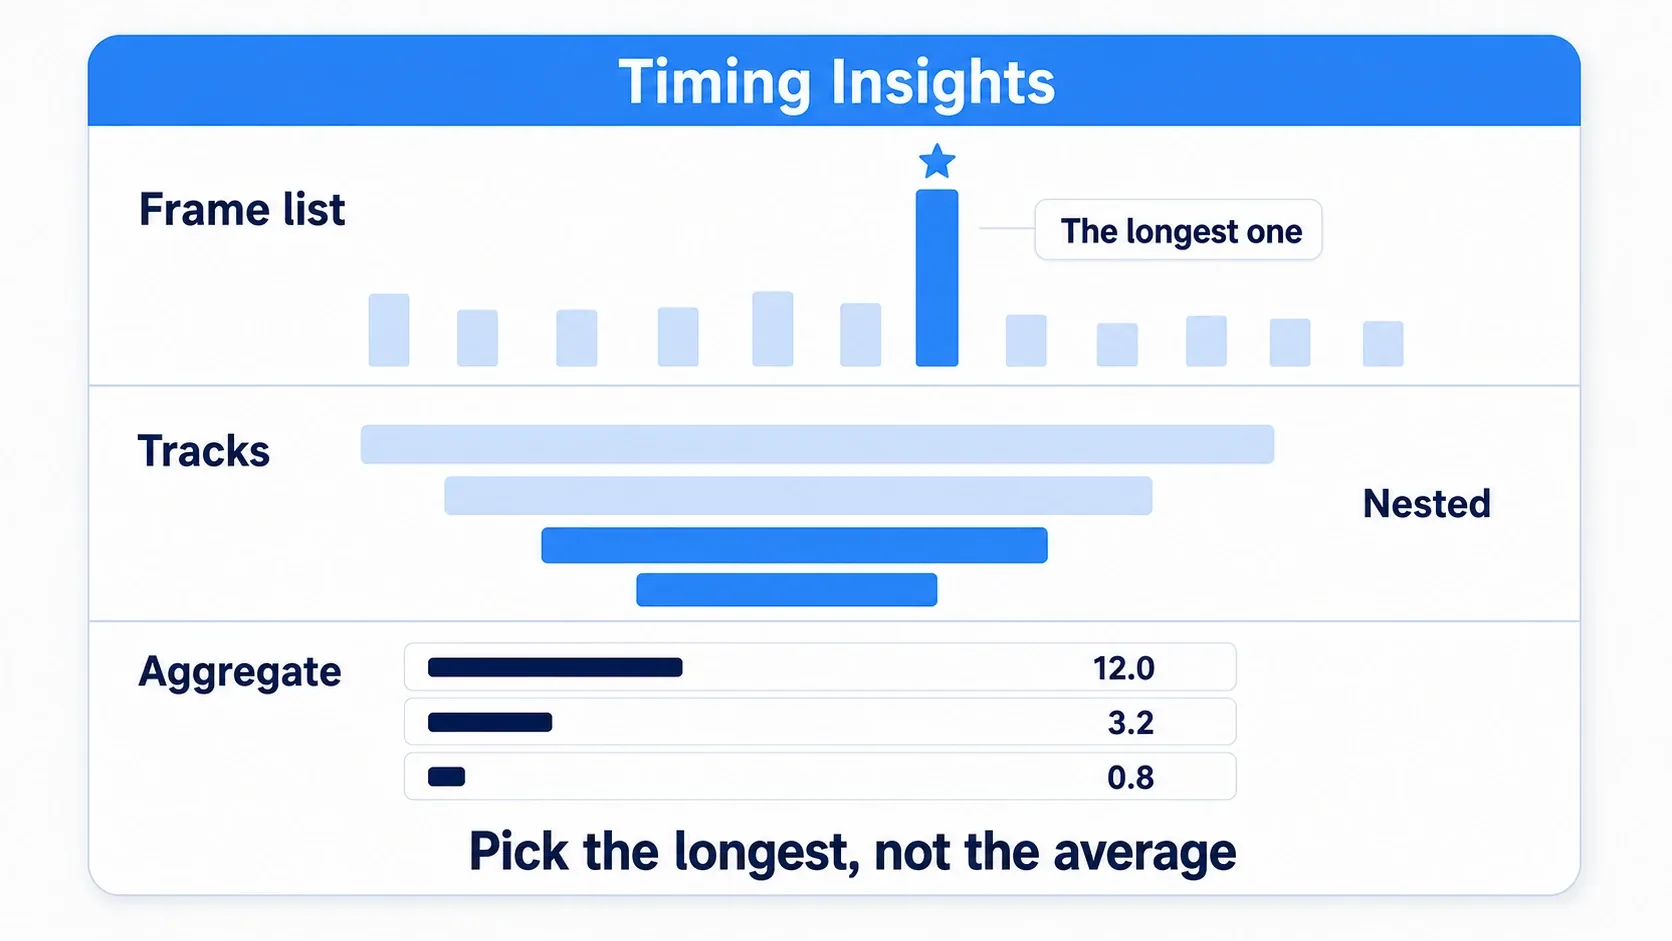
Three places to look.
| Area | What it shows |
|---|---|
| Frame list, top | Each frame's length as a bar. A bar that spikes is a hitch |
| Tracks, middle | Rows like GameThread / RenderThread. Calls appear as horizontal bars |
| Panel, bottom | Aggregates for the selection. Which work totals how many milliseconds |
The basic move is to find a long frame at the top and select it. Staring at the average never finds a hitch. Go straight for the single longest bar.
Selecting a frame switches the tracks to that moment's contents. Those horizontal bars are the actual work.
- Bar length = time that call took
- A bar hanging below another = work called by it
So descending from the top layer walks you toward the culprit.
Drilling Down to the Heavy Work
This is the heart of the tool. Open the widest bar, then the widest one under that.
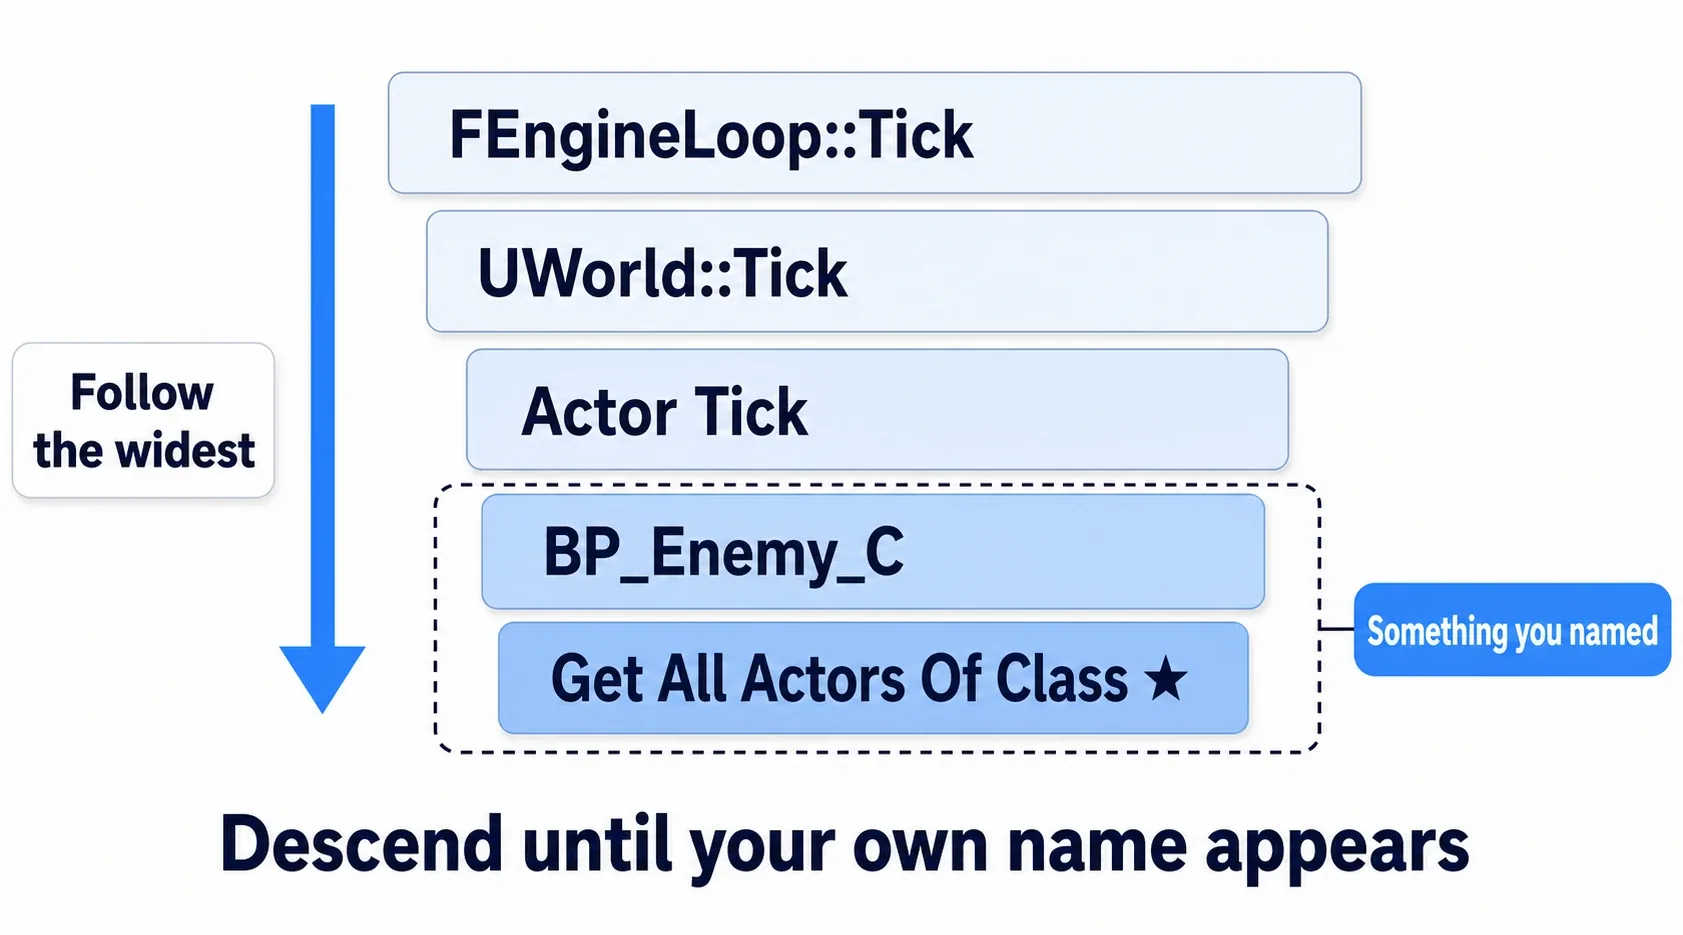
The loop is simple.
- Find the widest bar (you'll see broad names like
FEngineLoop::Tick) - Expand it and look at the layer below
- Pick the widest one again
- Repeat until a name you chose appears
When something like BP_Enemy_C or UpdateHealthBar shows up — something you named — that's your culprit. As long as you're still seeing engine-internal names, you haven't gone deep enough.
Many copies of the same name means count is the problem. Each may be short, but 200
BP_EnemyTickentries add up. In that case, making the work faster matters less than calling it less often (→ Designing Without Tick).
Memory Insights
To investigate memory rather than time, you have to launch with the Memory channel enabled.
This differs from the CPU workflow. Memory recording has to be active from the instant the process starts, or it can't account for allocations made before that. Starting a recording from the UI later tells you nothing about what loaded at startup.
MyGame.exe -trace=default,memory
Specify it as a launch argument, play, then open that trace.
What you get is when, what, and how much was allocated. Two main uses:
- What loads at startup — are assets you never use in memory? (→ Soft References and Async Loading)
- Whether memory grows during play — Actors or Widgets you forgot to destroy
The Memory channel makes recording heavier, so capture it separately from CPU investigations. Time today, memory tomorrow.
Hands-On: Track Down a Hitching Level
A wave-defense with swarms of enemies, an open-field exploration section, a bullet-hell shooter. "It only hitches in this one situation" follows the same procedure in any genre. Let's narrow down with stat and confirm with Insights.
Building a reproducible case
To identify a cause you need something that reliably hitches. If you don't have one, build this.
| Item | Details |
|---|---|
BP_Enemy | An Actor with a Static Mesh. On Event Tick, call Get All Actors Of Class (for BP_Enemy) and store the array's length in a variable |
| Count | Place 200 BP_Enemy in the level |
| Environment | Launch Standalone Game with -statnamedevents (not editor Play) |
Get All Actors Of Class walks the entire level — an expensive call. Having 200 actors call it every frame is guaranteed to hurt (it's also a staple of the common mistakes).
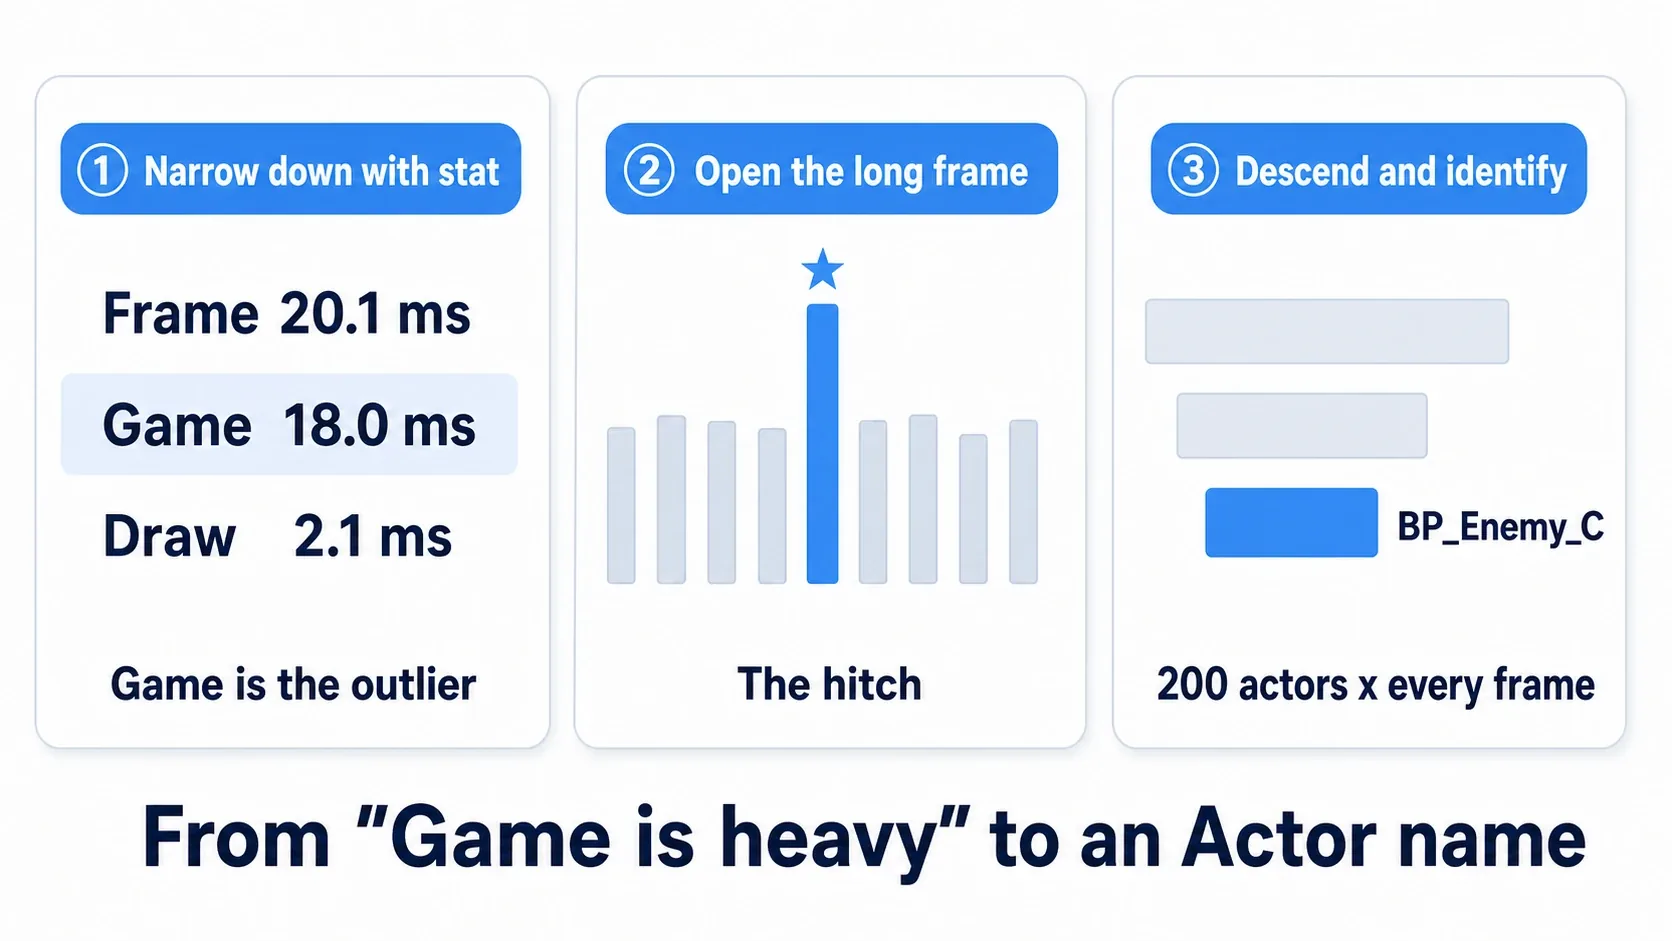
Steps
- Launch Standalone with
-statnamedeventsand typestat unitin the console. Confirm Game is the outlier (Draw and GPU should be small) - While it's hitching, start recording a trace. Channels: CPU and Frame
- Record about five seconds, stop, and open the saved
.utracein Unreal Insights - First confirm names are showing. Anything starting with
BP_means you're set (if not, revisit the launch arguments) - Open the Timing Insights tab and select the longest frame in the list at the top
- In the GameThread track, expand the widest bar, repeatedly
- When
BP_Enemy_Clines up underTick, you've found it. That's enough to know what to fix
Checking it
If it worked, most of the time stat unit attributed to Game is concentrated in BP_Enemy's Tick. 0.05 ms each, times 200, is 10 ms. What stat could only call "Game is heavy" now names which Actor is responsible.
Once you're at BP_Enemy_C, just open that Blueprint and read its Event Tick. Narrowing it to "this Actor is the heavy one" is enough — you can follow the contents by eye.
From here the fix picks itself: stop calling Get All Actors Of Class every frame — fetch it once into a variable, or drop Tick entirely. Then measure again the same way and confirm the Game number dropped.
Troubleshooting:
- Only engine-internal names appear → Two possibilities: you launched without
-statnamedevents, or you haven't expanded far enough. Check the launch arguments first, then keep picking the widest bar - Every frame is about the same length → That's not a hitch, it's consistently heavy. Same procedure; just pick any typical frame and descend
- The numbers differ from the editor → That's correct. Standalone is closer to reality
Two things to take away.
- Look at the longest single frame, not the average: hitches happen occasionally, so they vanish into averages. Aim straight at the spike in the frame list
- Measure in a state where your own names appear: knowing
FEngineLoop::Tickis heavy gives you nothing to act on. Adding-statnamedeventsand reachingBP_Enemy_Cis what defines the fix
If the fix is fewer things drawn, LOD and culling takes over; if it's constant spawning and destroying, object pooling does.
Bonus: Good to Know for Later
Anything but Shipping works. Traces record in Development builds too. To measure something close to the real thing, run a packaged Development build on the target hardware and record there.
Three launch arguments cover it. -trace=cpu,frame (what to record), -statnamedevents (surface your own names), and -trace=default,memory (record memory). When you want the cost of startup itself, the UI button is too late — start from arguments.
Trace files get big. A .utrace can hit hundreds of megabytes in seconds. Delete the ones you've finished with or they quietly eat your disk.
Make "measure, then fix" a habit. Fixing what you feel is slow misses the mark surprisingly often. Measure before, measure after. That round trip is the most reliable way to make progress on performance.
Summary
statnarrows down, Insights confirms. Use them in that order- Record with CPU and Frame first. Everything at once makes the recording itself heavy
- 🚨 Surfacing your Blueprint names needs
-statnamedevents. Confirm names appear before the real investigation - 🚨 Memory needs
-trace=default,memoryfrom launch. Starting later can't account for startup allocations - In Timing Insights, select the longest frame. Averages hide hitches
- Descend until something you named appears (
BP_Enemy_Cand the like) - For precision, measure in Standalone or a Development build
An investigation that used to stop at "Game is large" now reaches a function name. What is your project doing during its longest frame?