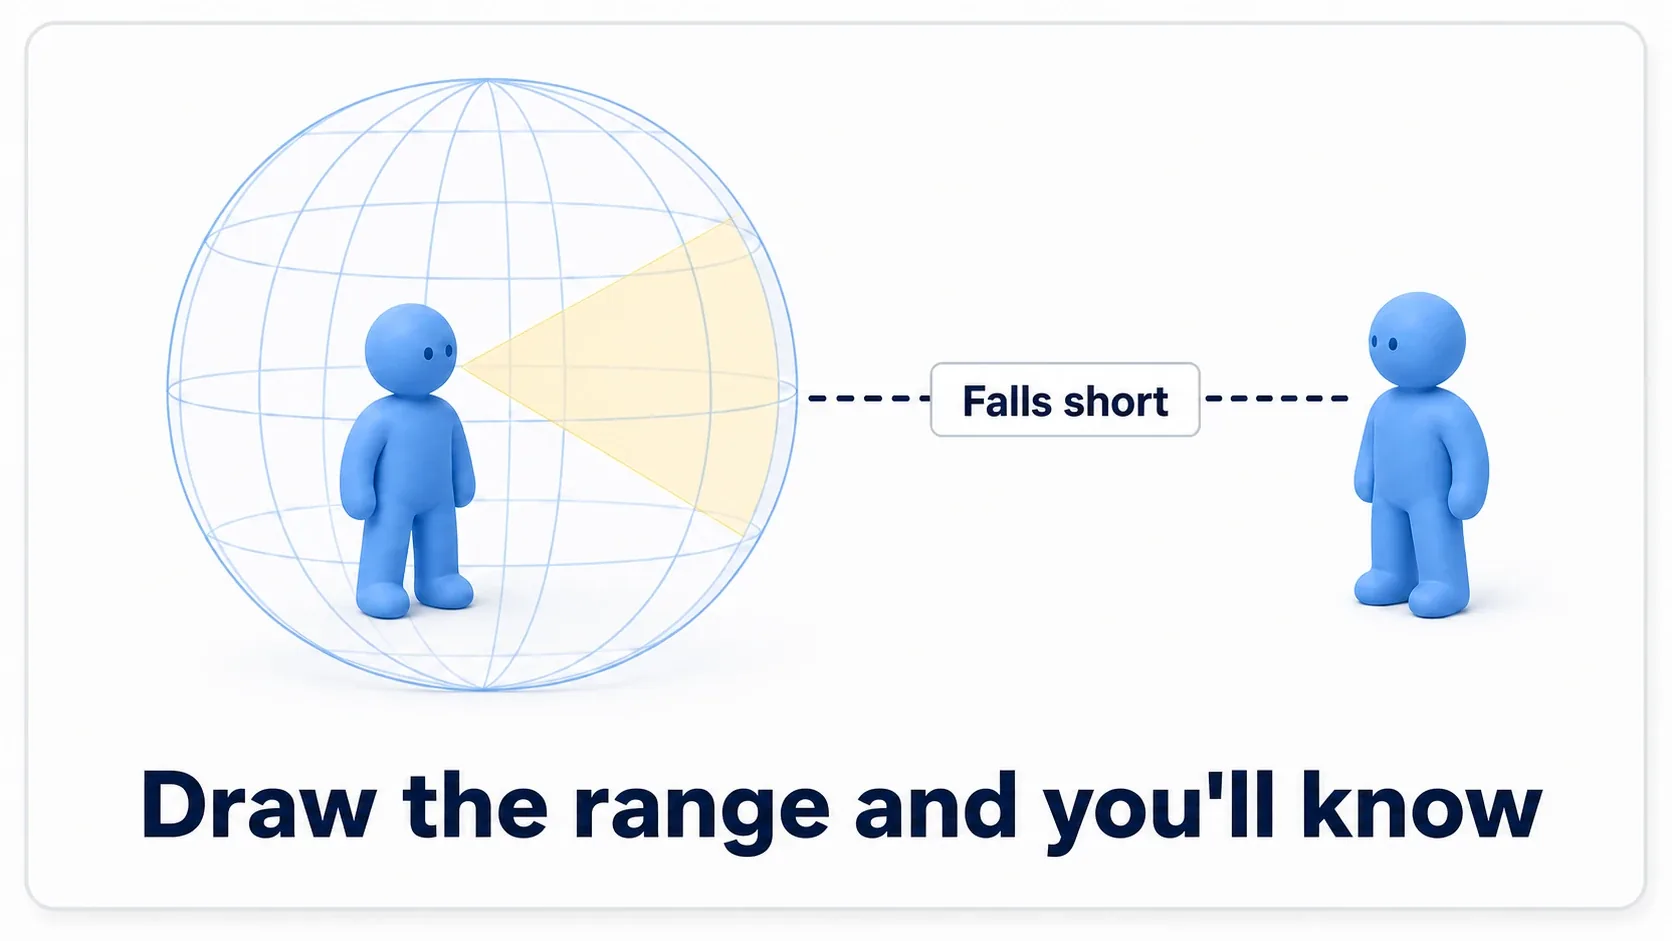
You wrote Sphere Radius = 800. But you have no idea how far 800 actually reaches. You set the enemy's field of view to 120 degrees. You can't see where that cone is pointing either.
Print String tells you values, but spatial information doesn't come through as text. Whether 800 matches the distance to the wall in front of you is something you can only learn by drawing it. This article covers the Draw Debug nodes that paint ranges and directions into the game world, plus Visual Logger for rewinding after the fact.
What You'll Learn
- Numbers and visible range don't match up in your head
Draw Debug Sphere/Line/Box/Arrow/Cone/String- What
Durationmeans (0when calling from Tick)- The editor's built-in views are often enough before you draw anything
- Rewinding with Visual Logger
- Hands-on: find why an AI won't react, by visualizing it
Numbers Don't Convey Distance
You type 800 into a Sphere Collision's Sphere Radius. You set an enemy's SightRange to 1200. Not even the person who typed it knows how far that reaches in the world.
A UE unit is one centimeter, so 800 is eight meters. But almost nobody can look at the hallway in front of them and say what fraction of it eight meters covers.
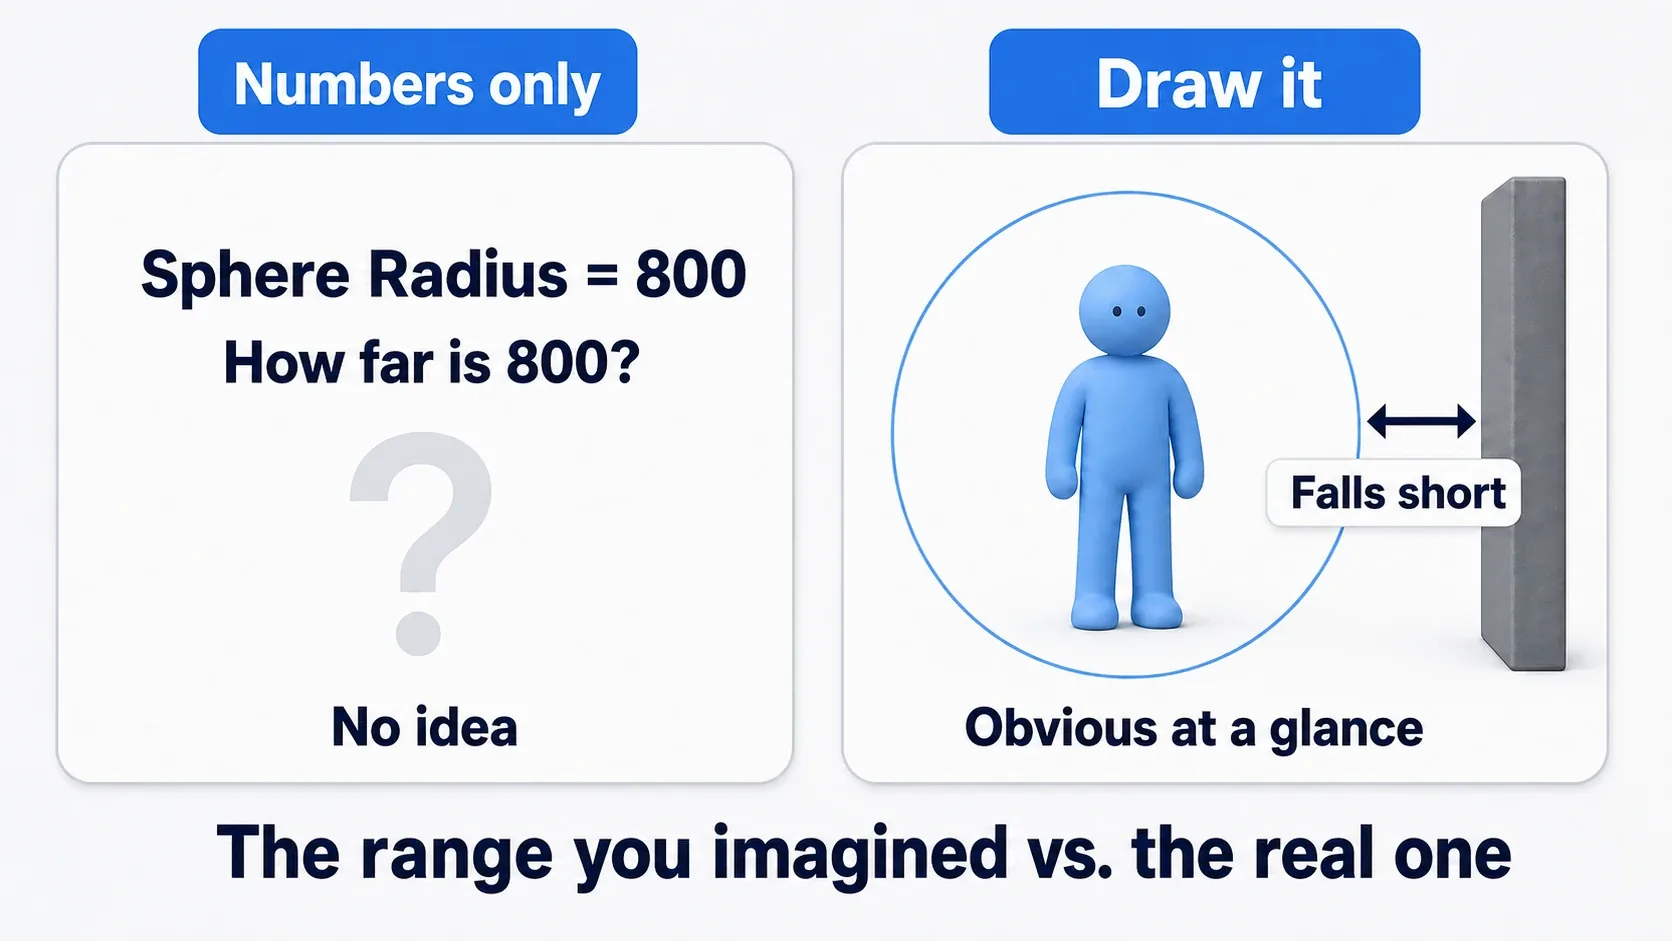
And most bugs live in the gap between the range you imagined and the range that exists.
- The enemy won't react → the detection range was narrower than you thought
- The enemy reacts through walls → it was wider than you thought
- Attacks don't land → the hit sphere was buried inside the character
Printing 800 with Print String gets you nowhere on any of these. Drawing it and looking is the fastest route.
The Draw Debug Nodes
Search Draw Debug in Blueprint and you get one node per shape. Six see most of the use.
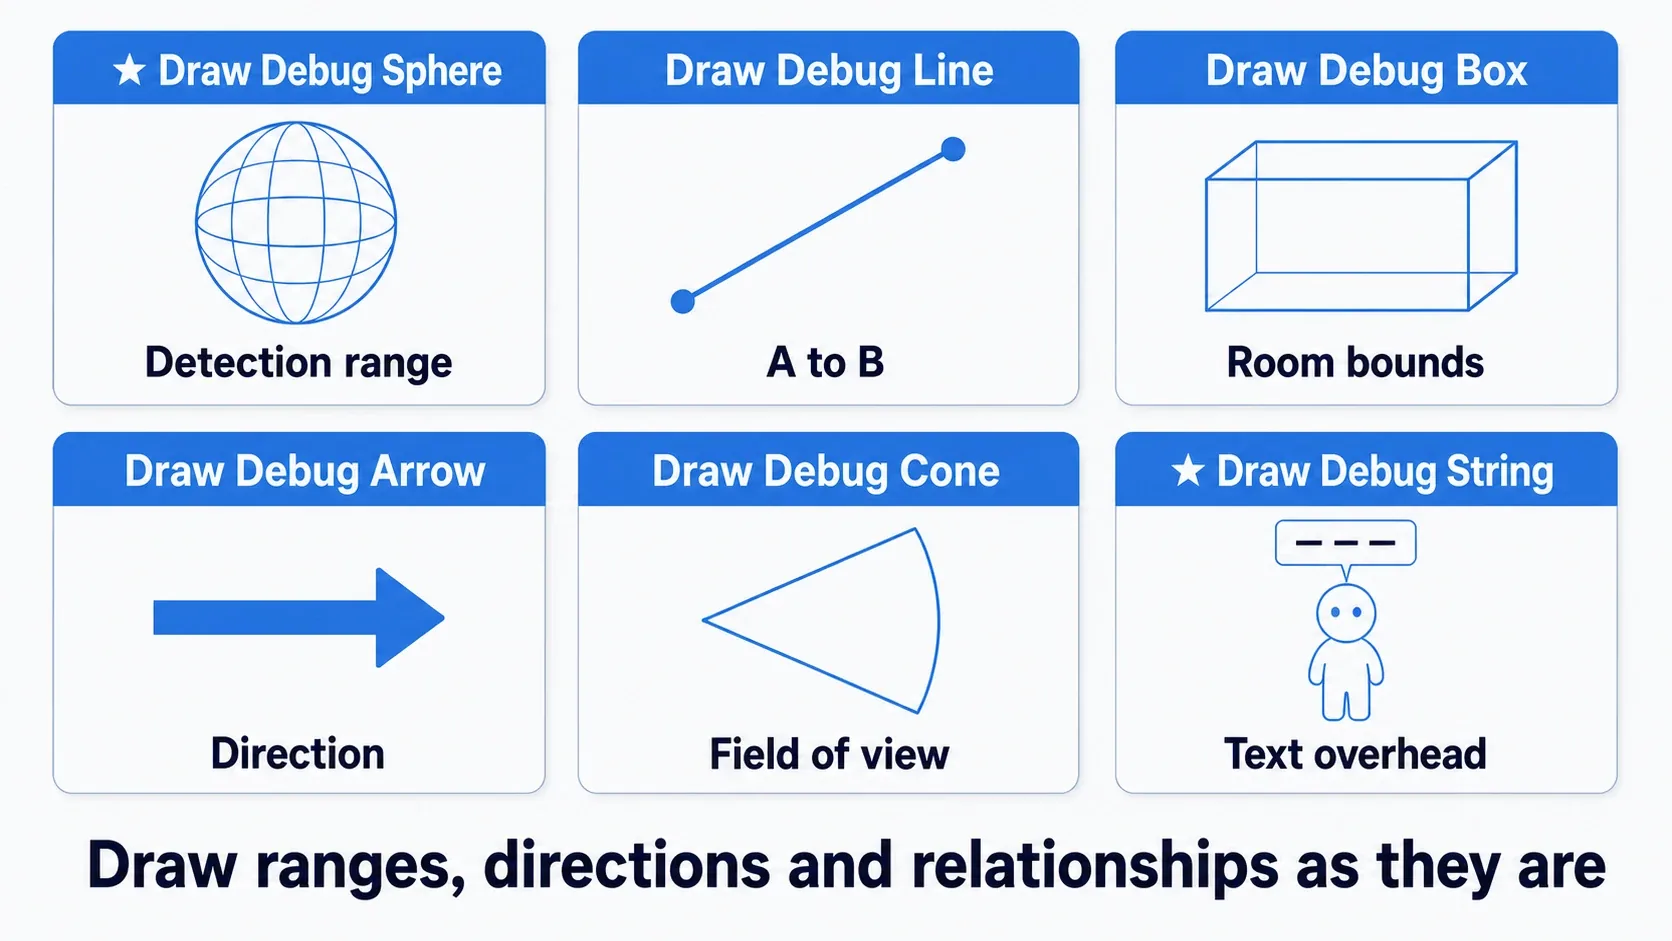
| Node | Draws | When |
|---|---|---|
| Draw Debug Sphere | A sphere | Detection and attack ranges. The most-used one |
| Draw Debug Line | A line | "From A to B" relationships. Linking to a target |
| Draw Debug Box | A box | Room bounds, where a Kill Volume sits |
| Draw Debug Arrow | An arrow | Direction. Movement, knockback |
| Draw Debug Cone | A cone | Field of view. A wedge-shaped detection range |
| Draw Debug String | Text in the world | State floating above an Actor |
The pins are similar across all of them. Position (and size), color, thickness, and Duration is all you need.
Draw Debug String deserves special mention. Where Print String piles everything into the top-left corner, this puts text directly above the Actor. With ten enemies on screen, each one can wear its own current state on its head (→ Enums and state machines).
Traces have their own drawing. Nodes like
Line Trace by Channelhave aDraw Debug Typepin; set it toFor Durationand the trace line and hit point draw automatically. That's easier for verifying traces, so use it there (→ the Line Trace article). TheDraw Debugfamily in this article is the general-purpose tool for everything that isn't a trace.
Duration and Where You Call It
The thing that trips everyone up is drawing something and watching it vanish instantly.
The culprit is Duration. It defaults to 0, which means "draw for a single frame."
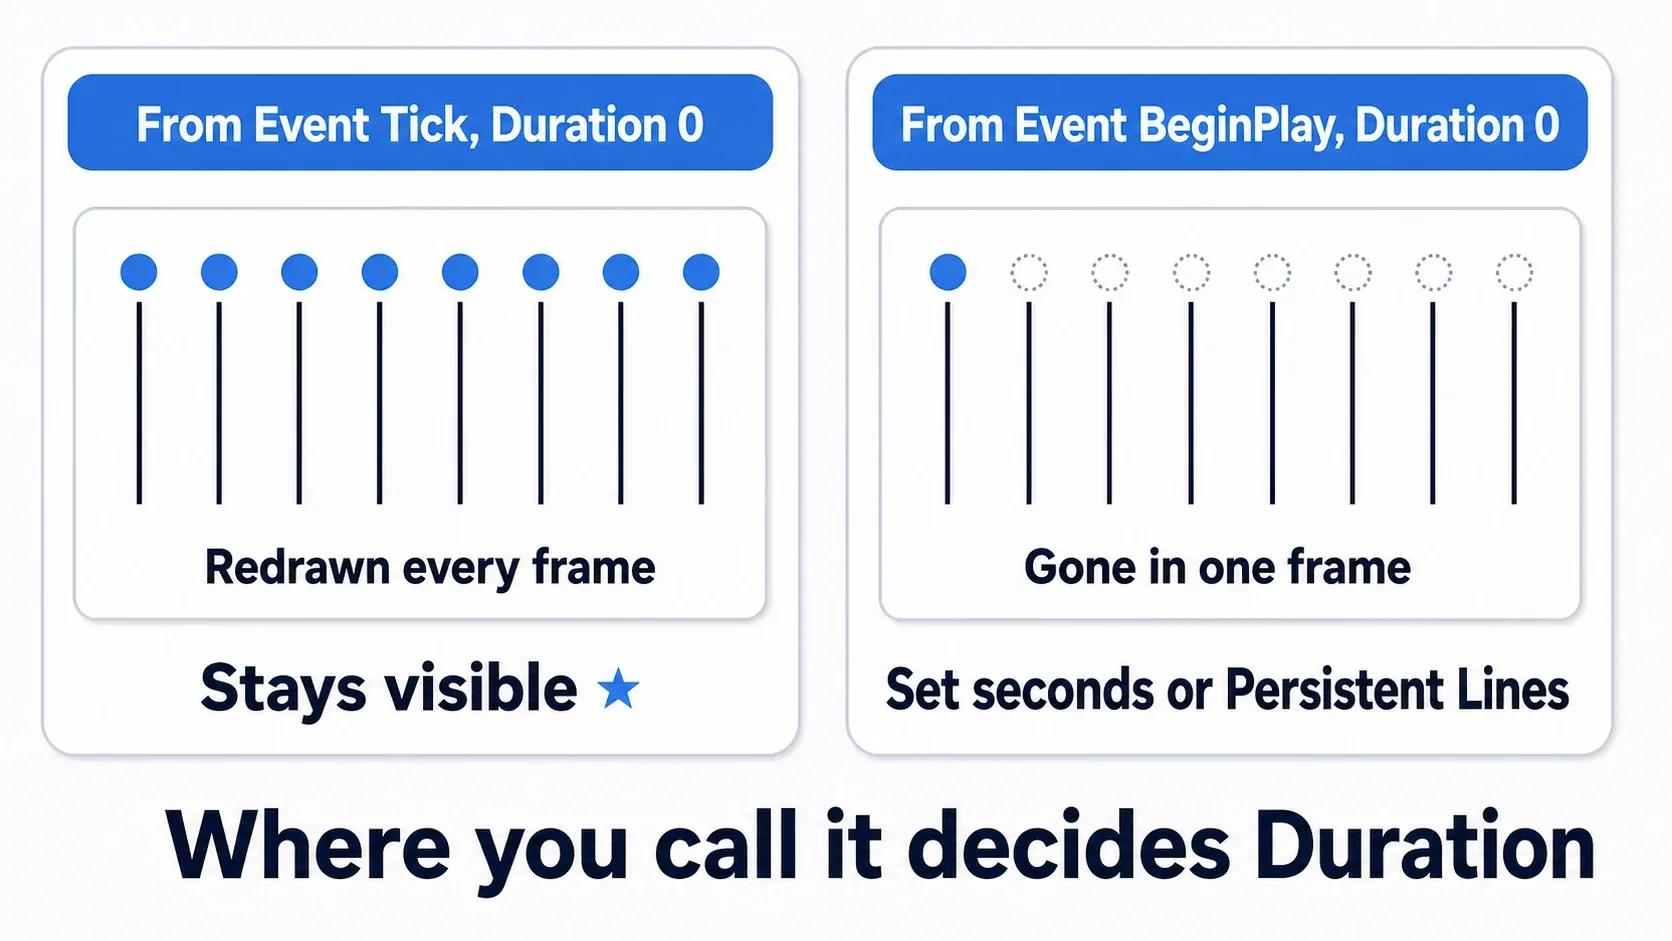
The right setting depends on where you call it.
| Called from | Duration | Result |
|---|---|---|
Event Tick (every frame) | Leave at 0 | Redrawn every frame, so it stays visible |
Event BeginPlay (once) | 10.0 or similar | Lasts that many seconds |
Event BeginPlay (permanent) | Enable Persistent Lines | Never disappears (clear with Flush Persistent Debug Lines) |
Remember it as: Tick for things that move, BeginPlay for things that don't.
- An enemy's detection range (moves with the enemy) →
Event TickwithDuration = 0 - A room's trigger volume (static) →
Event BeginPlaywithPersistent Lineson
Calling something from Tick may feel wrong, but debug drawing is meant to be removed once you're done, so it's fine here specifically (→ Designing Without Tick).
Try the Editor's Views First
Before you draw anything yourself, check whether what the editor already offers is enough. Zero effort.
| What you want to see | How |
|---|---|
| Collision shapes | Viewport Show → Collision, or Show Collision during Play |
| NavMesh (where AI can walk) | Press P in the viewport |
| A light's reach | Select the light Actor and its range appears as a wireframe |
| A component's bounds | Just select a Sphere or Box Collision |
That last one gets overlooked constantly. A Sphere Collision component shows its shape whenever it's selected, in the Blueprint editor or in the level. Change Sphere Radius and you watch it resize live.
Which means you don't need Draw Debug just to check a collision component's size. You need it when:
- You want to see the range during Play, while things move
- The value lives in code, not on a component (a
SightRangevariable) - You want to verify a computed result (which way
Find Look at Rotationended up pointing)
Rewinding with Visual Logger
Draw Debug draws the present moment. That's a problem when the moment you care about flashes by.
"The enemy turned toward me for an instant and then went back. What was it looking at?" — that's what Visual Logger is for.
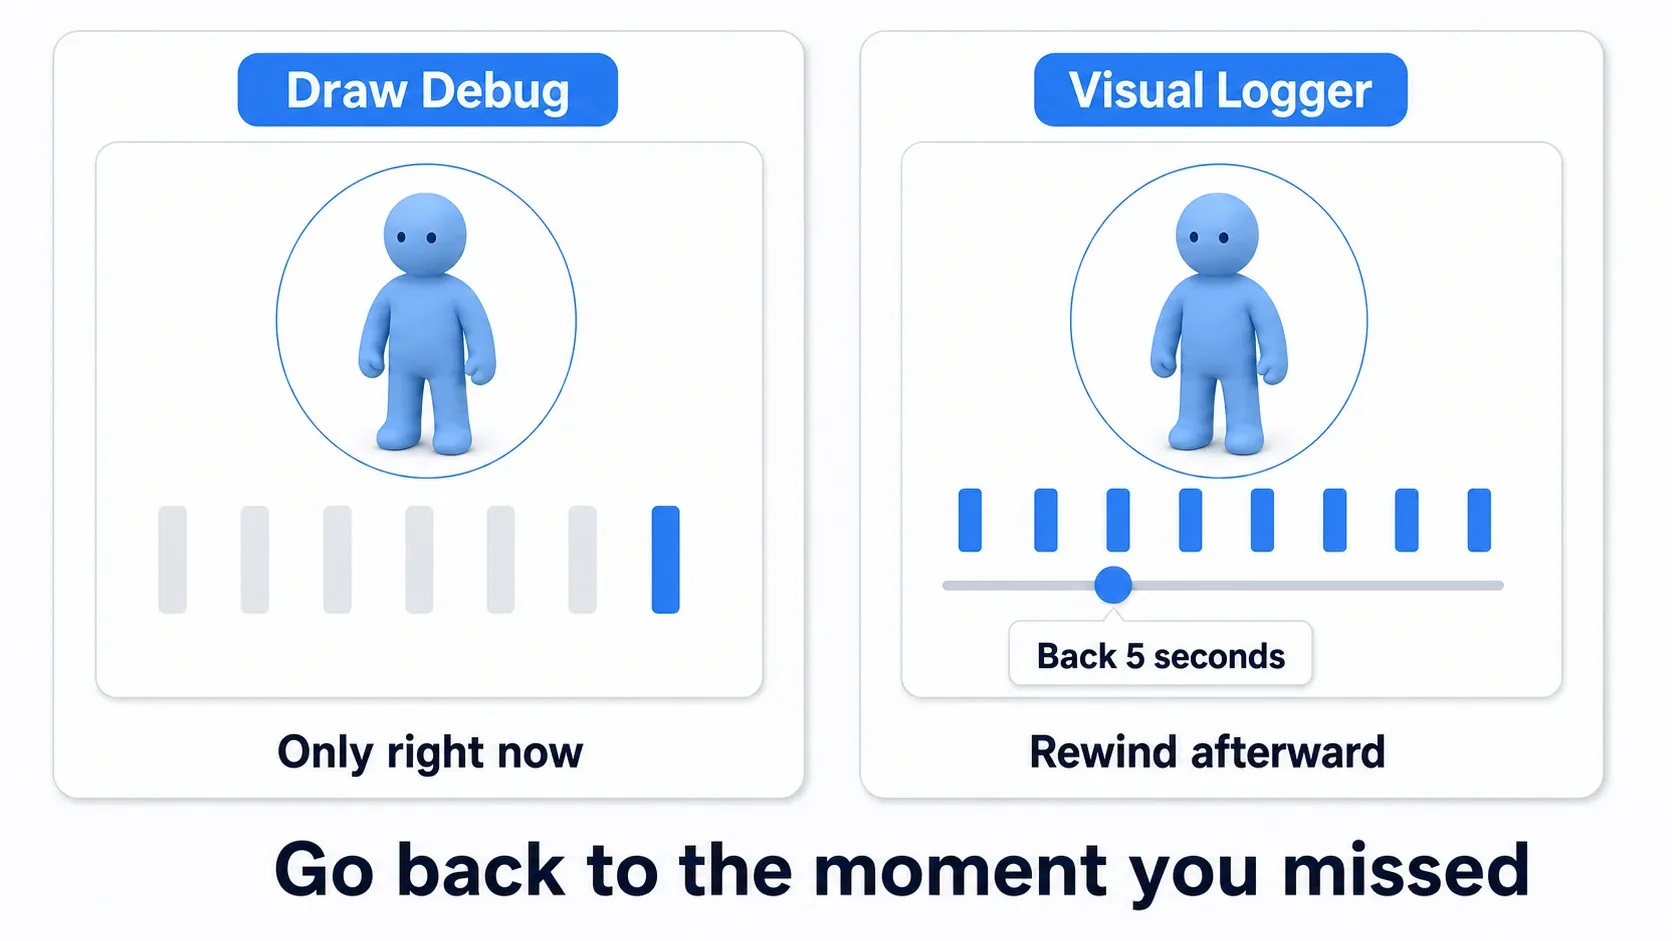
It records with a timeline so you can drag a slider to any moment afterward. It shines on AI. UE's AI systems (AI Perception and Behavior Trees) already send their data to Visual Logger — you don't instrument anything, you just open it.
The skeleton of using it:
- Open
Window → Visual Logger - Press record, then hit Play
- Stop, and a timeline appears along the bottom
- Pick an AI Actor from the list on the left and scrub the slider
The 3D view then reproduces what that AI was perceiving and where it was headed at that instant.
The UI is idiosyncratic and takes getting used to. But simply knowing it exists changes how long AI debugging takes. Reach for it when Draw Debug isn't enough.
Hands-On: Why Won't the AI React?
A stealth game's guard, a horror game's wanderer, a tower defense turret scanning for targets. "The enemy just won't react" happens to everyone who builds AI. We'll find the cause using nothing but visualization.
Building a reproducible case
| Item | Details |
|---|---|
BP_Guard | An Actor with a Static Mesh. Place one in the level |
Variable SightRange | Float, default 800.0 |
Variable SightAngle | Float, default 45.0 (half-angle) |
| The check | On Event Tick, if the player is within SightRange and within SightAngle of forward, Print String("Spotted") |
| Placement | Let the player stand 1000 units directly in front of BP_Guard |
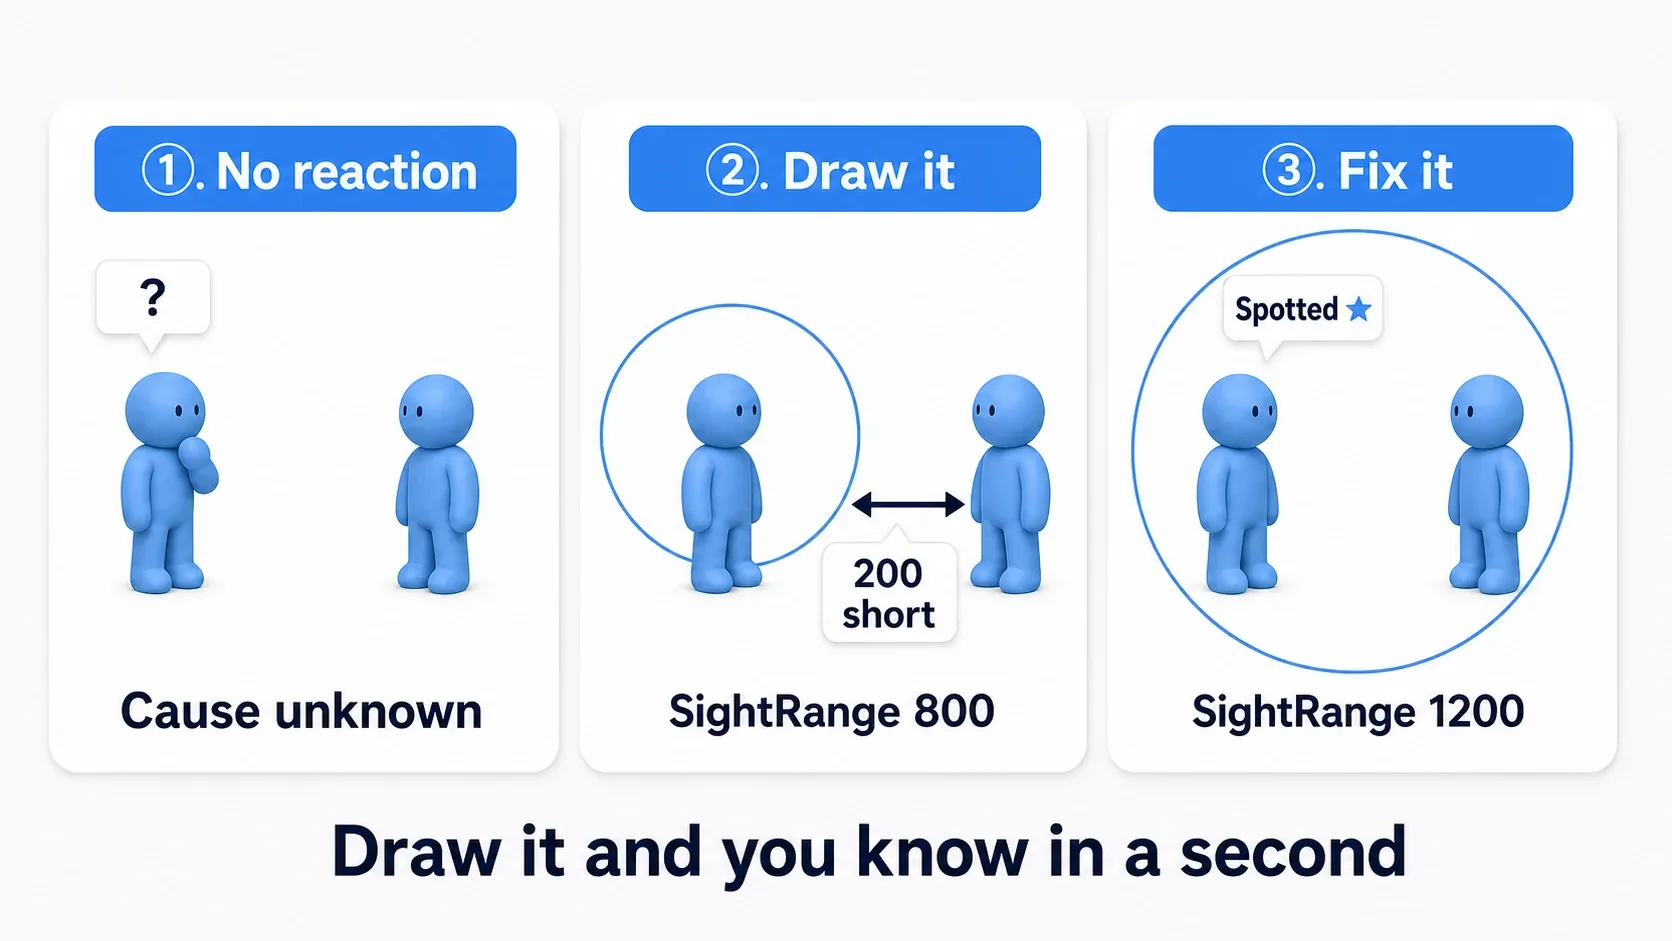
Hit Play and the player is right there, but "Spotted" never fires. The numbers won't tell you why. Let's draw it.
Adding the visualization
Add two draws to BP_Guard's Event Tick.
Draw Debug Sphere—Center=Get Actor Location,Radius=SightRange,Segments = 16,Line Colorblue,Duration = 0Draw Debug Cone—Origin=Get Actor Location,Direction=Get Actor Forward Vector,Length=SightRange,Angle WidthandAngle Height=SightAngle(converted to radians),Line Coloryellow,Duration = 0
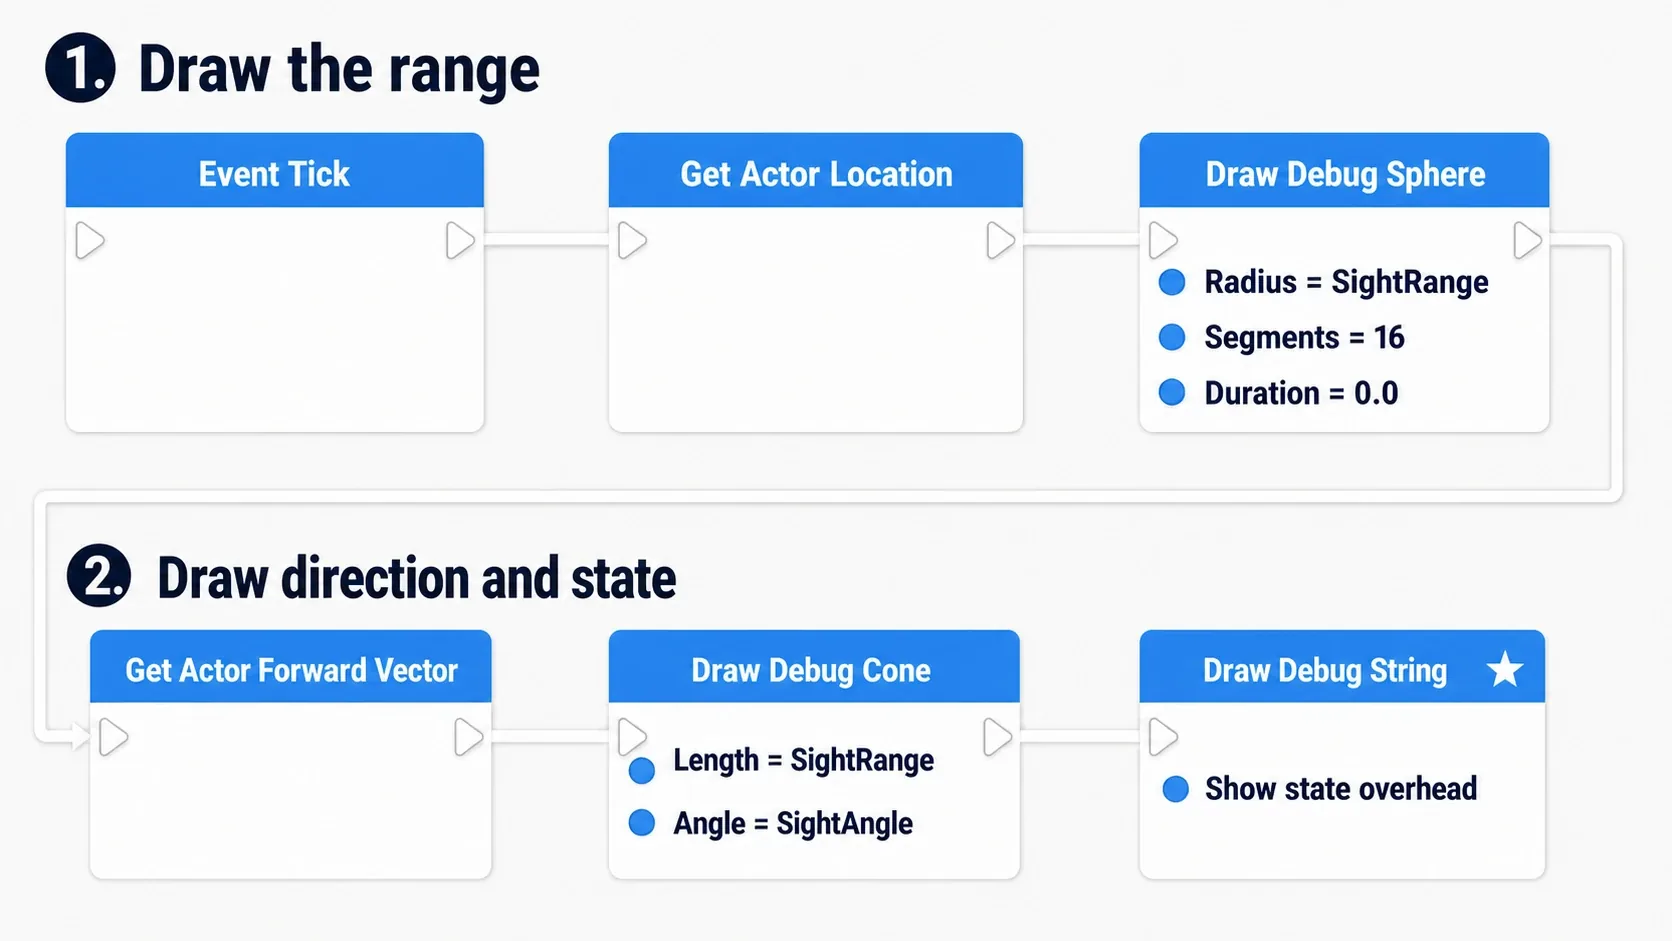
BP_Guard (Event Graph)
Event Tick
  → loc = GetActorLocation()
  → DrawDebugSphere(
        Center   = loc,
        Radius   = SightRange,
        Segments = 16,
        LineColor = blue,
        Duration = 0.0)
  → DrawDebugCone(
        Origin      = loc,
        Direction   = GetActorForwardVector(),
        Length      = SightRange,
        AngleWidth  = SightAngle (radians),
        AngleHeight = SightAngle (radians),
        LineColor   = yellow,
        Duration    = 0.0)
  → DrawDebugString(
        TextLocation = loc + (0, 0, 120),
        Text         = "Range: " + SightRange,
        Duration     = 0.0)
Checking it
Hit Play and a blue sphere surrounds the guard with a yellow wedge extending forward. And immediately obvious: the player is standing outside the blue sphere.
SightRange is 800; the player is at 1000. Two hundred units short. The reason no amount of Print String produced "Spotted" is now a one-second read.
Change SightRange to 1200 and Play again. Now the sphere engulfs the player and "Spotted" fires. You can see the range reach.
Next, move the player to the guard's side. They're inside the sphere but "Spotted" won't fire — because they're outside the yellow wedge. Change SightAngle from 45 to 90 and the wedge widens enough to catch them.
Troubleshooting:
- Nothing draws → You're calling from
Event BeginPlaywithDurationstill0. Move it to Tick or set a duration - The sphere shows but the cone doesn't →
Draw Debug Cone's angles are in radians. Feeding degrees directly produces a degenerate shape. InsertDegrees To Radians - It's buried in the floor →
Get Actor Locationis the Actor's center. Add+ (0, 0, 50)to lift it
Two things to take away.
- Draw before you doubt the number: whether it's "range too short" or "facing the wrong way" reads in a second once it's a picture. Faster than adding
Print Stringand guessing - Remove it when you're done: debug drawing costs render time. Delete the nodes, or gate them behind a
bShowDebugbool with aBranchso you can switch them off
When you want to follow a changing value instead of a range, stopping execution and inspecting it with the Blueprint Debugger takes over.
Bonus: Good to Know for Later
Shipping builds draw nothing. The Draw Debug family renders only in Development builds. Forgetting to remove one won't leak into your release — but it also means you can't use it for a range indicator players should see. Use a Decal or a translucent material for that.
Drawing too much gets heavy. A hundred enemies each drawing a sphere and a cone every frame is a real cost. Restrict it to whatever you're investigating. A single bShowDebug bool with a Branch makes that easy.
Segments is the quality/cost dial. Draw Debug Sphere's Segments is the sphere's subdivision count. The default 12 reads fine; 24 looks smoother. It multiplies line count, so keep it low when drawing many.
Assign colors by meaning. Fixing conventions like "detection is blue, vision is yellow, attack range is red" keeps multiple overlapping ranges readable. The convention only has to make sense to you.
Summary
- Numbers and visible range don't line up in your head. Most bugs live in that gap
- The workhorses are Sphere (range), Cone (vision), Arrow (direction), String (text overhead)
Durationfollows where you call it:0from Tick, seconds orPersistent Linesfrom BeginPlay- Before drawing, check whether selecting the component,
Show Collision, orPis enough - When the moment you need flashes by, rewind with Visual Logger
"It won't react" is nearly always either the range or the facing. Next time an AI ignores you, what will you draw first?